Make any chart with AI
Your data has astory worth charting
Skip the manual chart building. Transform your data into beautiful visuals and powerful insights.


Trusted by teams at
How it works
From a raw spreadsheet to a chart worth sharing — four steps, zero formula wrangling.
Add your data
Connect a live database or app, drop in a CSV or XLSX, paste a table — or just ask AI to go find the numbers for you.
Let AI build it
Make it yours
Share it anywhere
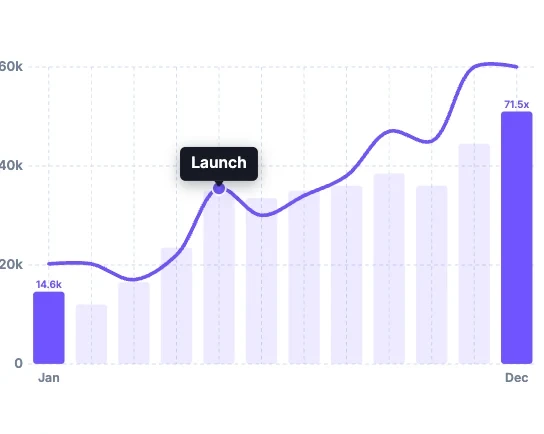
MRR grew 5x
Consistent MoM growth averaging ~18% in H2 turned a promising start into a 5x MRR year
The Grapharium
Start with popular chart types, or browse bars, lines, areas, dots, hierarchies, networks, maps, and fun — generate any graph with AI.
-
 Bar Chart
-
 Line Chart
-
 Pie Chart
-
 Scatterplot
-
 Area Chart
-
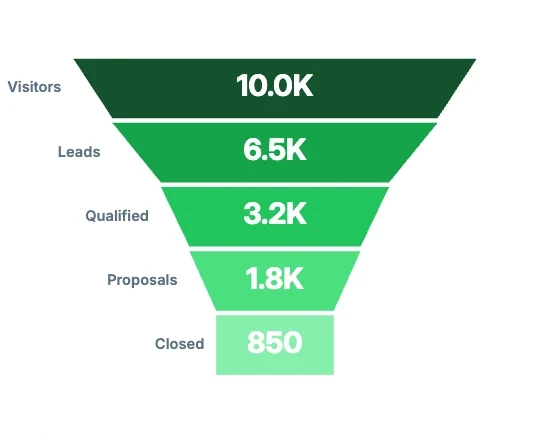
 Funnel Chart
-
 Box Plot
-
 Radar Chart
-
 Sparkline
-
 Treemap
-
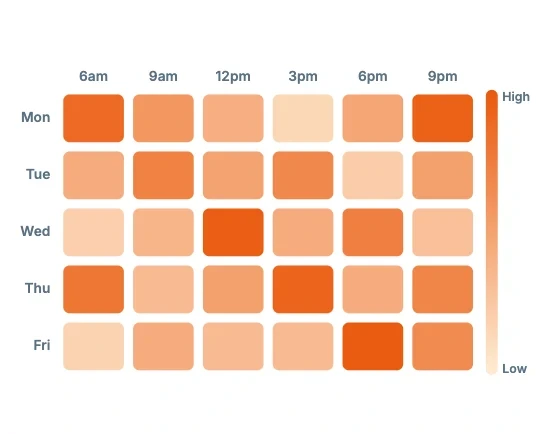
 Heatmap
-
 Waterfall Chart
-
 Sankey Diagram
-
 Choropleth Map
-
 Combo Chart
-
 Histogram
-
 Bullet Chart
-
 Lollipop Chart
-
 Marimekko Chart
-
 Pareto Chart
-
 Likert Scale Chart
-
Bar Chart
-
 Column Chart
-
 Horizontal Bar Chart
-
 Stacked Bar Chart
-
 Grouped Bar Chart
-
 Comparison Chart
-
 Gantt Chart
-
Waterfall Chart
-
 Pictogram Chart
-
Line Chart
-
 Multi-Line Chart
-
 Time Series Chart
-
Sparkline
-
 Candlestick Chart
-
 Stock Chart
-
 Trendline Chart
-
 Timeline Chart
-
 Bridge Chart
-
 Roadmap Chart
-
Area Chart
-
 Stacked Area Chart
-
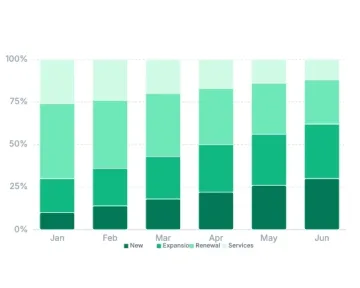
 100% Stacked Area
-
 Streamgraph
-
 Difference Chart
-
 Band Chart
-
 Horizon Chart
-
 Ridgeline Plot
-
 Area Chart (Missing Data)
-
 Control Chart
-
 Step Area Chart
-
 Stacked Area + Columns
-
 3D Area Chart
-
 Dot Plot
-
Scatterplot
-
 Bubble Chart
-
Heatmap
-
 Hexbin Chart
-
 Matrix Chart
-
 Correlation Chart
-
 Pair Plot
-
 Bubble Map


-
Treemap
-
 Nested Treemap
-
 Icicle Chart
-
 Organization Chart
-
 Mind Map
-
 Tree Diagram
-
 Family Tree Chart
-
 Decision Tree
-
 Circle Packing Chart
-
 Pyramid Diagram
-
 Force-Directed Tree
-
Sankey Diagram
-
 Chord Diagram
-
 Flowchart
-
 Process Flow Diagram
-
 Workflow Diagram
-
 Concept Map
-
 SIPOC Diagram
-
 Fishbone Diagram
-
 Swimlane Diagram
-
 Network Graph
-
 Ecomap
-
 Kanban Board
-
 Affinity Diagram
-
 Cycle Diagram
-
Box Plot
-
 Statistical Chart
-
 Parallel Coordinates
-
Combo Chart
-
 Dual-Axis Chart
-
 SWOT Analysis Chart
-
 RACI Matrix
-
 T-Chart
-
 Data Table Chart


Stop screenshotting. Ship the chart.
Start charting freeGraphs in minutes
not sprints
-
No six-month dashboard project
Describe what you want, get the chart, move on.
-
The data's already there
Anyone on the team can pull their own chart for their use case.
-
Ready to present in minutes
Not after a round of reformatting.
AI ASSISTANT
EXPAND
One tool
for the whole team
-
Spin up more graphs
The data comes with it, so anyone can slice it differently and build new charts in seconds.
-
One source of truth
Everyone sees the same live numbers, with nothing to reconcile later.
-
Shared where you work
Drop it into Slack, a deck, or a doc, wherever the team already is.
Supercharge your charts with data connectors
Plug in Stripe, Postgres, Salesforce, or 1,000+ sources — your charts stay live without copy-paste.
-
1
Pick a source
Postgres, Stripe, HubSpot, GA4 — 1,000+ connectors, zero CSV wrangling.
-
2
Plug it in
Sign in, pick your table. Yes — it's as simple as that.
-
3
Charts auto-sync
Source data changes, your chart updates. No refresh button required.
Set it once — auto-sync keeps every chart current.
Frequently asked questions
If your question is not covered here, you can contact our team.
Contact usWhat chart types does Sourcetable support?
Sourcetable supports 96+ chart types including bar, column, line, area, pie, doughnut, scatter, bubble, heatmap, funnel, waterfall, stock, radar, treemap, map, and combo charts. Ask in plain English and AI picks the right visualization.
Do charts update automatically when my data changes?
Yes. When you connect Stripe, Salesforce, or a database, Sourcetable refreshes the underlying data and your charts update with it.
Can I embed charts on my website or in documents?
Yes. Export PNG or PDF, or embed live-updating charts in websites, Notion docs, internal wikis, and presentations.
How is this different from Excel or Google Sheets charts?
Excel and Sheets require manual data selection and formatting. Sourcetable lets you describe what you want and builds the chart for you, then keeps it live as connected data changes.
Can I schedule charts to be emailed or sent to Slack?
Yes. Set up automated reports on a daily, weekly, or monthly schedule so your team always has the latest numbers.
Is Sourcetable charting free?
Yes. Start for free at sourcetable.com/signup. Core spreadsheet and charting features are on the free plan.
Turn data into a
bar chart
Describe the chart in plain English. Sourcetable builds it, formats it, and keeps it live.
Drop CSV