Enterprise-grade Security
Your data is protected by industry-leading SOC 2 Type 2, HIPAA, and PCI compliance standards, whether in our cloud or on-premises.
Private User Keys
Encrypted at REST
Escrow KMS
You've never seen a spreadsheet do this before.
| A | B | C | D | E | |
|---|---|---|---|---|---|
| 1 |
Task
|
Project
|
Due Date
|
Status
|
Assignee
|
| 2 |
API integration
|
Backend
|
2025-12-18
|
In Progress
|
Sarah
|
| 3 |
Design review
|
Frontend
|
2025-12-20
|
Complete
|
Michael
|
| 4 |
User testing
|
Product
|
2025-12-22
|
Not Started
|
Emma
|
| 5 |
Documentation
|
Engineering
|
2025-12-15
|
In Progress
|
James
|
| 6 |
QA testing
|
Quality
|
2025-12-19
|
Complete
|
Lisa
|
Use Pivotal Tracker, show me tasks due this week
— Project Manager
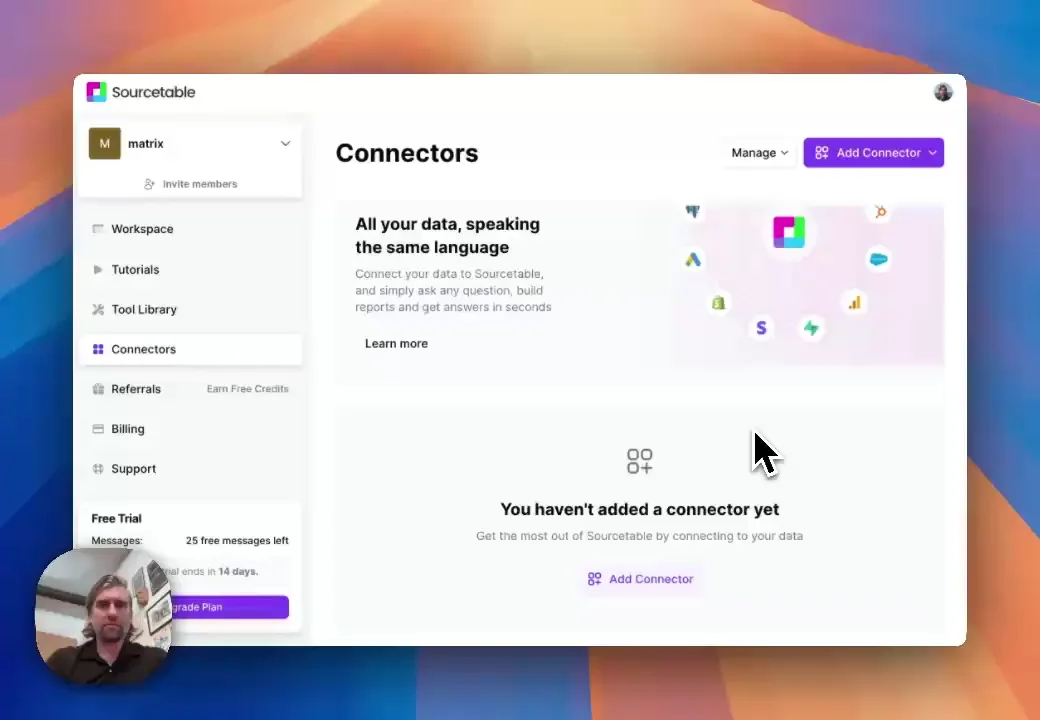
Just click and connect.
Your data is protected by industry-leading SOC 2 Type 2, HIPAA, and PCI compliance standards, whether in our cloud or on-premises.
Private User Keys
Encrypted at REST
Escrow KMS

Connect your most-used data sources and tools to Sourcetable for seamless analysis.
If your question is not covered here, you can contact our team.
Contact UsTurn your data into actionable insights.