The HEVI Method: A Scientific Framework for AI Trading Strategies in 2026
The scientific method, applied to markets. A four-phase framework for building, testing, deploying, and refining trading strategies—powered by AI, no coding required.

Andrew Grosser
February 12, 2026 • 15 min read
Here's a number that should make you uncomfortable: roughly 90% of retail traders lose money. Not because they lack intelligence or discipline, but because they trade on instinct in a market dominated by algorithms. Wall Street's top quantitative funds spend billions on data infrastructure, machine learning models, and automated execution systems. The individual trader checking candlestick charts on a phone screen is bringing a butter knife to a gunfight.
But 2026 is different. AI has democratized what used to require a physics PhD and a Bloomberg terminal. A single spreadsheet can now search the web for research, analyze the results, backtest a strategy against historical data, and execute live trades—all in one place. The gap between institutional and retail isn't strategy knowledge—it's workflow. The best traders in the world follow a rigorous, repeatable process. And now, that process fits inside a spreadsheet.
Sourcetable's AI trading analyst is free to try. Sign up here.
Why Most Traders Fail (And What the Winners Do Differently)
Manual trading is emotional trading. You see a red candle and panic sell. You see a green candle and FOMO buy. You revenge-trade after a loss. You double down when you should cut. Every behavioral finance study from Kahneman to Thaler tells us the same story: humans are spectacularly bad at making rational decisions under uncertainty.
The traders who consistently win—whether they manage a multi-billion dollar hedge fund or a personal account—share one thing in common: they treat trading like science, not gambling. They form hypotheses. They test them. They verify results in the real world. And they refine relentlessly. They never, ever deviate from the process because of a gut feeling.
This scientific approach has a structure. We call it HEVI: Hypothesize, Evaluate, Validate, Iterate. It's the scientific method applied to markets—four phases that transform speculation into systematic edge. And with AI handling the computational heavy lifting, anyone can follow it.
The HEVI Method: Hypothesize, Evaluate, Validate, Iterate
Scientists don't guess. They observe, form hypotheses, design experiments, analyze results, and refine their models. The HEVI method applies that same rigor to trading. You start with an idea, stress-test it against historical data, prove it works with real money on the line, and continuously improve it as markets evolve.
| Phase | Scientific Parallel | Goal | With AI Spreadsheets |
|---|---|---|---|
| Hypothesize | Form a hypothesis | Identify and structure strategy ideas | AI extracts trading rules from research papers, books, and data |
| Evaluate | Run the experiment | Backtest against historical data | Built-in backtesting tool—describe strategy in plain English, get instant results |
| Validate | Verify findings | Deploy with small capital, confirm live results | Live dashboards with automated monitoring and risk alerts |
| Iterate | Refine the model | Optimize parameters, adapt to new conditions | Rapid re-testing of variations, continuous performance tracking |
Let's walk through each phase.
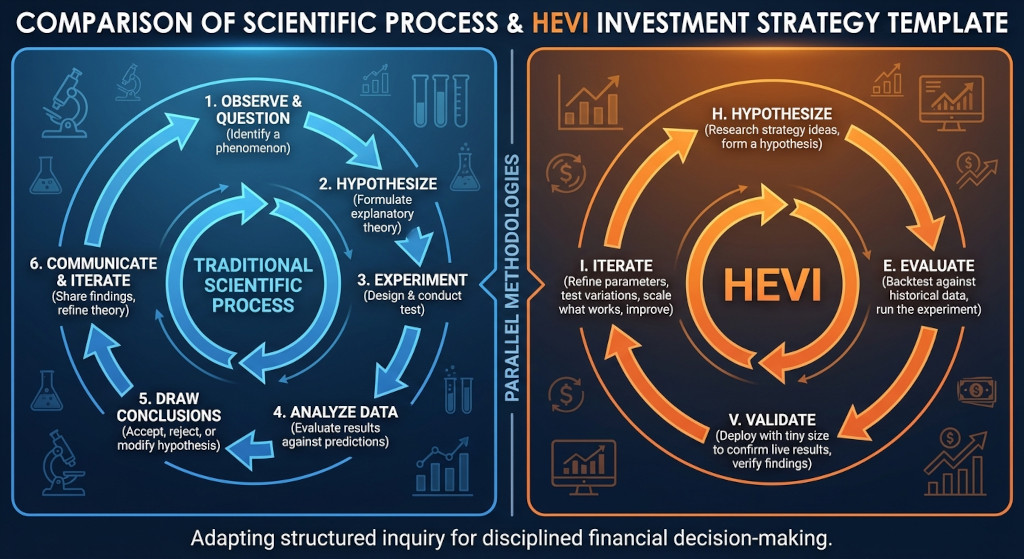
The HEVI Method maps the scientific process directly to systematic trading: Hypothesize, Evaluate, Validate, Iterate.
Phase 1: Hypothesize — Forming Your Trading Thesis
Every experiment begins with a question. In trading, that question is: "Is there a repeatable pattern in this market that I can exploit?" The Hypothesize phase is where you build a library of testable ideas—not hunches, not tips from Reddit, but structured hypotheses grounded in research.
Where Good Hypotheses Come From
-
Academic Research: Google Scholar is a goldmine. PhDs publish papers on trading anomalies, factor premiums, and market microstructure. Strategies like momentum, mean reversion, and carry have decades of academic evidence behind them. With Sourcetable, you don't even need to leave the spreadsheet—its built-in web search lets you research strategies, pull up academic papers, and scan financial news directly from where you work.
-
Books: Start with the classics. Market Wizards by Jack Schwager interviews the greatest traders alive. The Man Who Solved the Market tells the story of Jim Simons and Renaissance Technologies. Fooled by Randomness by Nassim Taleb will make you question everything you think you know about luck versus skill.
-
Podcasts and Interviews: Shows like Chat with Traders feature working professionals who share real strategies, real failures, and real numbers. The signal-to-noise ratio is much higher than social media.
-
Quantitative Communities: Forums like QuantConnect and various Discord communities share backtested strategies with full parameter sets. Treat these as starting points for your own hypotheses, not finished products.
-
Live Web Research Inside Sourcetable: Sourcetable can search the web and do research for you—all without leaving the spreadsheet. Ask it to find the latest earnings data, look up options chain pricing, research a new strategy concept, or pull recent analyst commentary. Your research, your data, and your analysis all live in one place.
Structuring Your Hypothesis
A good trading hypothesis is specific and falsifiable, just like a scientific one. "The market will go up" is not a hypothesis. "When RSI drops below 25 on a large-cap equity, mean reversion produces a positive expected return over the following 5 trading days" is a hypothesis. It has clear entry conditions, a defined holding period, and a measurable outcome.
With Sourcetable, you can paste an academic abstract or strategy description and ask AI to extract the trading rules, key parameters, and testable conditions—or skip the pasting entirely and ask Sourcetable to search the web for you. Tell it to research mean reversion strategies for small-cap equities, and it will find relevant papers, blog posts, and data sources, then synthesize the findings right in your spreadsheet. What used to take an afternoon of careful reading takes 30 seconds. Build a living hypothesis library in your spreadsheet—each row a strategy idea, columns tracking the source, asset class, expected edge, and status. Need a starting point? Sourcetable's library of 185 trading strategies covers everything from basic covered calls to advanced statistical arbitrage, each with detailed implementation guides.
Phase 2: Evaluate — Running the Experiment
A hypothesis that sounds brilliant in theory might be catastrophic in practice. The only way to know? Run it against the data. Evaluation means backtesting your strategy against years of real market history to see what would have happened. Sourcetable has a built-in backtesting tool that makes this as simple as describing your strategy in plain English.
Does a strategy that worked in the past guarantee future profits? Absolutely not. But here's the logic: a strategy that didn't work in the past is almost certainly going to fail in the future. Evaluation eliminates the losers before they cost you money.
Designing a Rigorous Backtest
-
Multiple Timeframes: A strategy that works on hourly charts but fails on daily charts might be capturing noise, not signal. Test across 1-hour, 4-hour, daily, and weekly intervals.
-
Multiple Assets: If a momentum strategy works on Bitcoin but fails on Ethereum and SPY, it's probably overfit to one asset's history. Robust strategies work across multiple instruments.
-
Key Metrics: Look beyond total return. Track Sharpe ratio (risk-adjusted returns), maximum drawdown (worst peak-to-trough decline), win rate, average win vs. average loss, and profit factor.
-
Commissions and Slippage: A backtest that ignores trading costs is a fantasy. Always include realistic commission fees and slippage estimates. A strategy that returns 2% annually before costs might be deeply negative after them.
The Built-In Backtesting Advantage
In the old world, backtesting required Python proficiency, data engineering skills, and days of debugging. You'd write hundreds of lines of code just to test whether a simple Bollinger Band breakout was profitable.
Sourcetable's built-in backtesting tool eliminates all of that. Pick any strategy from the 185 pre-built strategy guides or describe your own in plain English: "Backtest a strategy that buys when RSI drops below 30 and sells when it rises above 70, on SPY daily data from 2020 to 2025, with $100,000 starting capital and 0.1% commission." The backtester handles data loading, indicator calculations, trade execution logic, and performance reporting. You get a complete report—equity curves, drawdown analysis, trade-by-trade logs—in seconds.
Because the tool runs inside the spreadsheet, results flow directly into analysis and comparison. When evaluation takes seconds instead of days, you can test hundreds of strategy variations. Compare momentum against mean reversion against statistical arbitrage in an afternoon. The speed of experimentation is the edge.
From Backtest to Live Orders in One Workflow
Here's what makes Sourcetable's Evaluate phase genuinely different: the same spreadsheet where you backtest a strategy can place live orders through Robinhood. There's no export step, no switching tools, no re-entering parameters into a separate trading platform. You evaluate a strategy, like what you see, and go live—all without leaving the sheet.
This matters because the traditional workflow is riddled with friction. You backtest in Python, copy the parameters into a broker's interface, and hope you didn't make a transcription error. With Sourcetable's Robinhood integration, your backtested strategy and your live execution share the same data, the same logic, and the same environment. The gap between "this looks good on paper" and "let's see if it works for real" shrinks to a single click.
Phase 3: Validate — Confirming Results in the Real World
Your backtest looks promising. The Sharpe ratio is above 1.5, the maximum drawdown is tolerable, and the strategy works across multiple assets and timeframes. In science, this is the moment you move from the lab to a field trial. In trading, you validate.
Validation means deploying a strategy with the smallest possible position size and monitoring it obsessively. The goal isn't to make money—it's to verify that live performance matches backtested expectations. Markets have frictions that backtests can't fully capture: liquidity gaps, order execution delays, overnight funding costs, and regime changes.
With Sourcetable, validation isn't a separate workflow—it's a natural extension of evaluation. Because you can place live orders directly through Robinhood from the same spreadsheet where you backtested, your validation environment is identical to your testing environment. Same data feeds, same strategy logic, same risk parameters. The only variable that changes is whether the money is real.
The Validation Checklist
-
Start Tiny: Robinhood supports fractional shares and has no commission fees on stocks—perfect for validation with minimal capital. Buy $5 of SPY to test execution before scaling to meaningful size.
-
Set Risk Controls First: Define your maximum daily loss, maximum position size, and maximum number of concurrent trades before you start. Never adjust these mid-trade.
-
Monitor Early and Often: Check after the first few trades, then every 12 hours, then daily. Look for discrepancies between expected and actual fill prices, slippage, and execution timing.
-
Track Everything: Every trade, every fill price, every fee. Because orders execute through Robinhood directly from Sourcetable, your trade log builds itself automatically—no manual entry, no reconciliation errors.
-
Require Statistical Significance: Only declare a strategy "validated" after a meaningful sample of live trades. A common threshold: at least 30 trades before drawing conclusions.
Live Execution and Monitoring in One Place
This is the workflow that used to require three separate tools: a backtester, a broker interface, and a monitoring dashboard. Sourcetable collapses all three into one. Your Robinhood account connects directly to the spreadsheet. You can place market orders, limit orders, and stop-losses without leaving the sheet. Live positions, real-time P&L, and portfolio allocation update automatically alongside your backtested expectations—so you can see, at a glance, whether reality matches the model.
When a strategy's live Sharpe ratio drifts more than one standard deviation from its backtest, you see it immediately. When a position hits its risk limit, the alert fires in the same environment where you manage the trade. No tab-switching, no copy-pasting between platforms, no lag between signal and action.
Phase 4: Iterate — Refining the Edge
Here's where HEVI diverges from a one-and-done approach. Markets are not static. Volatility regimes shift. Correlations break down. Strategies that printed money in 2024 might bleed in 2026. The Iterate phase is what separates a fragile trading system from an antifragile one.
Iteration means continuously monitoring your validated strategies, asking new questions, and feeding the answers back into the cycle. It's the flywheel that makes the whole system compound over time.
What Iteration Looks Like in Practice
-
Parameter Optimization: Your RSI strategy uses a 14-period lookback. Would 10 or 21 perform better in the current regime? Re-run the backtest with a parameter sweep and compare.
-
Regime Detection: Track whether your strategy performs differently in high-volatility vs. low-volatility environments. If it does, build conditional rules: run the strategy only when VIX is below 25, for example.
-
Strategy Rotation: Maintain a portfolio of strategies and weight them dynamically based on recent performance. When momentum strategies stall, mean reversion strategies often thrive—and vice versa.
-
New Hypotheses: Every iteration generates new questions. Why did the strategy underperform last month? Is there an additional filter that would improve win rate? Feed these observations back into Phase 1 and the cycle continues.
-
Scaling Decisions: Strategies that survive multiple iteration cycles with consistent performance earn larger allocations. Strategies that degrade get reduced or retired. This is Darwinian selection applied to your portfolio.
With Sourcetable's backtesting tool and live data connections, iteration is fast. You can re-evaluate a strategy against the last 6 months of data, compare it to its original backtest, and decide whether to adjust parameters—all in the same spreadsheet where you track live positions.
Strategy Categories Worth Exploring
The HEVI method works for any strategy type. Here are the major categories, each with distinct risk/reward characteristics and market conditions where they shine.
Technical Indicator Strategies
These strategies use mathematical indicators derived from price and volume data to generate signals. They're the most accessible starting point for new systematic traders.
RSI & Stochastic RSI: Identify overbought and oversold conditions. StochRSI combines the Stochastic formula with RSI for sharper signals—particularly effective in ranging markets.
Bollinger Band Breakouts: Trade expansions from periods of low volatility. When bands squeeze tight, a breakout is coming—the question is direction.
MACD Histogram: Track momentum shifts using the convergence and divergence of moving averages. Histogram reversals often precede price reversals.
Money Flow Index (MFI): A volume-weighted RSI that incorporates buying and selling pressure. More reliable than standard RSI because volume confirms price moves.
Ichimoku Cloud: A complete trading system in a single indicator. The cloud defines support, resistance, trend direction, and momentum simultaneously.
Mean Reversion Strategies
Based on the statistical tendency of prices to return to their average over time. When an asset moves too far from its mean, you bet on the snapback. These strategies thrive in range-bound markets and suffer during strong trends.
Pairs Trading: Find two correlated assets (Coca-Cola and Pepsi, for example). When their spread widens beyond historical norms, go long the underperformer and short the outperformer.
Z-Score Mean Reversion: Calculate how many standard deviations an asset has moved from its rolling mean. Enter when the Z-score exceeds ±2 and exit at zero.
Bollinger Band Mean Reversion: Buy at the lower band, sell at the upper band. The opposite of breakout trading—you're betting the bands will contain price.
Momentum Strategies
The academic evidence for momentum is overwhelming. Assets that have performed well recently tend to continue performing well in the short to medium term. Momentum is one of the few market anomalies that has persisted across asset classes, geographies, and time periods.
Relative Strength Ranking: Rank a universe of assets by recent performance and go long the top decile while shorting the bottom decile.
Dual Momentum: Combine absolute momentum (is the asset trending up?) with relative momentum (is it outperforming alternatives?) for a more robust signal.
Breakout Momentum: Enter positions when price breaks above recent highs with increasing volume. The classic trend-following approach used by the Turtle Traders.
Options Strategies
Options add a dimension that stock trading lacks: you can profit from volatility itself, not just direction. Sourcetable's AI Trading Strategies library covers 185 options strategies in detail, from basic covered calls to advanced iron condor variations.
The Wheel Strategy: Sell cash-secured puts until assigned, then sell covered calls against the shares. A systematic income approach that compounds premium over time.
Iron Condors: Sell an out-of-the-money call spread and put spread simultaneously. Profit when the underlying stays within a defined range—ideal for low-volatility environments. See short iron condor and long iron condor.
Straddles and Strangles: Buy both a call and put to profit from large moves in either direction. Best deployed before earnings announcements or major catalysts. See long straddle and long strangle.
Broken Wing Butterflies: Modified butterfly spreads with unequal wing widths that create asymmetric risk profiles—reduced or zero cost on one side. See put broken wing and call broken wing, plus their inverse variants.
Jade Lizard: Combine a short put with a short call spread to collect premium while eliminating upside risk entirely. The jade lizard and its mirror image, the reverse jade lizard, are favorites among advanced income traders.
Synthetic Positions: Replicate option payoffs using stock-option combinations for capital efficiency. A synthetic put combines short stock with a long call to create an equivalent put position—useful when puts are expensive or illiquid.
Double Diagonal: The double diagonal spread combines two diagonal spreads across four strikes and two expirations. More flexible than iron condors with better vega exposure—ideal for traders who want both time decay and volatility upside.
Quantitative and Factor Strategies
These are the strategies that Renaissance Technologies, Two Sigma, and D.E. Shaw deploy at massive scale. They identify persistent statistical relationships in market data and exploit them systematically.
Value Factor: Buy assets that are cheap relative to fundamentals (earnings, book value, cash flow) and short expensive ones. The intellectual foundation of Warren Buffett's approach, systematized.
Carry: Profit from the interest rate differential between currencies, or from futures curves in backwardation. The FX carry trade is one of the oldest systematic strategies in finance.
Statistical Arbitrage: Use machine learning to identify short-term pricing inefficiencies across hundreds of securities simultaneously. The bread and butter of quantitative hedge funds.
Building Your Reading List
The best traders are voracious readers. Not because books give you a magic formula—they don't—but because they teach you how winners think. Here are the books that belong on every systematic trader's shelf.
Market Wizards (Jack Schwager) — Interviews with the greatest traders of a generation. Four books in the series, all worth reading. You'll notice a pattern: every wizard has a system.
The Man Who Solved the Market (Gregory Zuckerman) — The story of Jim Simons and Renaissance Technologies, the most successful quantitative fund in history. A masterclass in what systematic trading looks like at the highest level.
Fooled by Randomness (Nassim Nicholas Taleb) — Why most trading "skill" is actually luck. This book will destroy your illusions and make you a better risk manager.
The Complete TurtleTrader (Michael Covel) — The story of Richard Dennis's famous experiment: can trading be taught? The answer is yes, if you have a system and the discipline to follow it.
Thinking, Fast and Slow (Daniel Kahneman) — The foundational text on cognitive biases. Every bias Kahneman describes—anchoring, loss aversion, the availability heuristic—shows up in your trading. Understanding them is the first step to neutralizing them.
A Random Walk Down Wall Street (Burton Malkiel) — The case that markets are efficient. Even if you disagree, understanding the efficient market hypothesis makes you a sharper thinker about where edges actually exist.
The Key Insight: Process Over Prediction
Here's the uncomfortable truth that every successful systematic trader eventually accepts: you cannot predict the market. Not with certainty. Not ever. The price of Apple stock tomorrow is unknowable. The direction of Bitcoin next week is unknowable. Anyone who tells you otherwise is selling something.
What you can do is tilt the odds. Strategies validated against historical data are not guaranteed to work in the future—but they are significantly more likely to work than strategies you haven't tested. That probability edge, compounded over hundreds of trades with strict risk management, is how systematic traders build wealth.
The HEVI method isn't about being right on any single trade. It's about having a process that is right on average, across a large enough sample, with losses small enough to survive. And because it's a cycle—not a straight line—you're always improving. Every iteration sharpens the edge. That's the real advantage of treating trading like science: the system gets smarter over time, even when individual experiments fail.
How Sourcetable Powers Every Phase of HEVI
Sourcetable isn't a trading platform—it's the analytical engine behind your trading. Research, backtesting, live execution, and monitoring all happen in one place. Here's how it maps to each phase:
-
Hypothesize: Search the web for academic papers, earnings transcripts, or strategy descriptions directly from Sourcetable—or paste them in—and ask AI to extract the trading rules, parameters, and risk factors. Research, organize, and structure your ideas without ever leaving the spreadsheet. Build a living hypothesis library that grows with every idea you explore.
-
Evaluate: Use the built-in backtesting tool to test any strategy. Describe it in plain English and get instant results—equity curves, Sharpe ratios, drawdown analysis, and trade logs. When a strategy passes, go live through Robinhood without leaving the spreadsheet.
-
Validate: Place live orders through Robinhood directly from the spreadsheet. Track every position, monitor real-time P&L against backtested expectations, and get alerts when performance deviates—all in one place, no platform-switching required.
-
Iterate: Re-run backtests against recent data, compare to original results, optimize parameters, and rotate strategies—all without leaving the same spreadsheet where you track live positions. Explore 185 pre-built trading strategy guides for new ideas to feed back into the cycle.
What is the HEVI method for trading?
HEVI stands for Hypothesize, Evaluate, Validate, Iterate—a four-phase framework that applies the scientific method to systematic trading. In the Hypothesize phase, you identify and structure strategy ideas from academic research, books, and quantitative communities. In the Evaluate phase, you backtest those hypotheses against historical market data. In the Validate phase, you deploy with minimal capital to confirm live results match expectations. In the Iterate phase, you refine parameters, adapt to changing market conditions, and feed new observations back into the cycle.
Can I build trading strategies without coding?
Yes. Sourcetable has a built-in backtesting tool that lets you describe trading strategies in plain English and get instant results—performance metrics, equity curves, and risk analysis. You don't need to write Python, use command-line tools, or manage data infrastructure. The backtester handles indicator calculations, trade execution logic, and statistical analysis automatically, all inside the spreadsheet.
What trading strategy should beginners start with?
Beginners should start with simple, well-documented strategies that have strong academic evidence. RSI mean reversion (buying when RSI drops below 30, selling above 70) and simple moving average crossovers are good starting points because they're easy to understand, easy to backtest, and teach you the fundamentals of systematic trading. Avoid complex multi-leg options strategies or high-frequency approaches until you've mastered the basics.
How many strategies should I backtest before going live?
There's no magic number, but experienced systematic traders typically evaluate dozens of variations before deploying a single strategy live. The key is testing across multiple assets, timeframes, and market conditions. A strategy that only works on one asset in one time period is likely overfit. With Sourcetable's backtesting tool, you can test hundreds of variations quickly—so the limiting factor is your judgment, not your time.
Is algorithmic trading profitable for retail traders?
Algorithmic trading can be profitable for retail traders who follow a disciplined, scientific process. The key advantages are removing emotional bias, ensuring consistent execution, and enabling thorough evaluation before risking real capital. However, no strategy guarantees profits. The edge comes from rigorous hypothesis formation, realistic backtesting (including commissions and slippage), proper risk management, and continuous iteration as markets evolve.
Key Takeaways
-
Approximately 90% of retail traders lose money, primarily because they trade on emotion rather than following a systematic, evidence-based process.
-
The HEVI method—Hypothesize, Evaluate, Validate, Iterate—applies the scientific method to trading and can be executed entirely within an AI spreadsheet with built-in backtesting.
-
Sourcetable's backtesting tool reduces strategy evaluation from days of coding to seconds of natural language description, enabling traders to test hundreds of variations before risking real capital.
-
No strategy guarantees future profits, but strategies validated against historical data are significantly more likely to succeed than untested intuition. The Iterate phase ensures your edge evolves with the market.
What is the HEVI method for trading?
Can I build trading strategies without coding?
What trading strategy should beginners start with?
How many strategies should I backtest before going live?
Is algorithmic trading profitable for retail traders?
Ready to build your trading edge?
Hypothesize, evaluate, validate, and iterate on trading strategies with AI. No coding required.