Dashboard Generator
Build powerful dashboards in seconds with AI
Sourcetable's AI Dashboard Generator analyzes your spreadsheet data and automatically creates interactive dashboards with KPIs, charts, and insights. Go from raw data to executive-ready dashboards, monitor key metrics in real-time, and make data-driven decisions faster - no dashboard expertise required.
Try for Free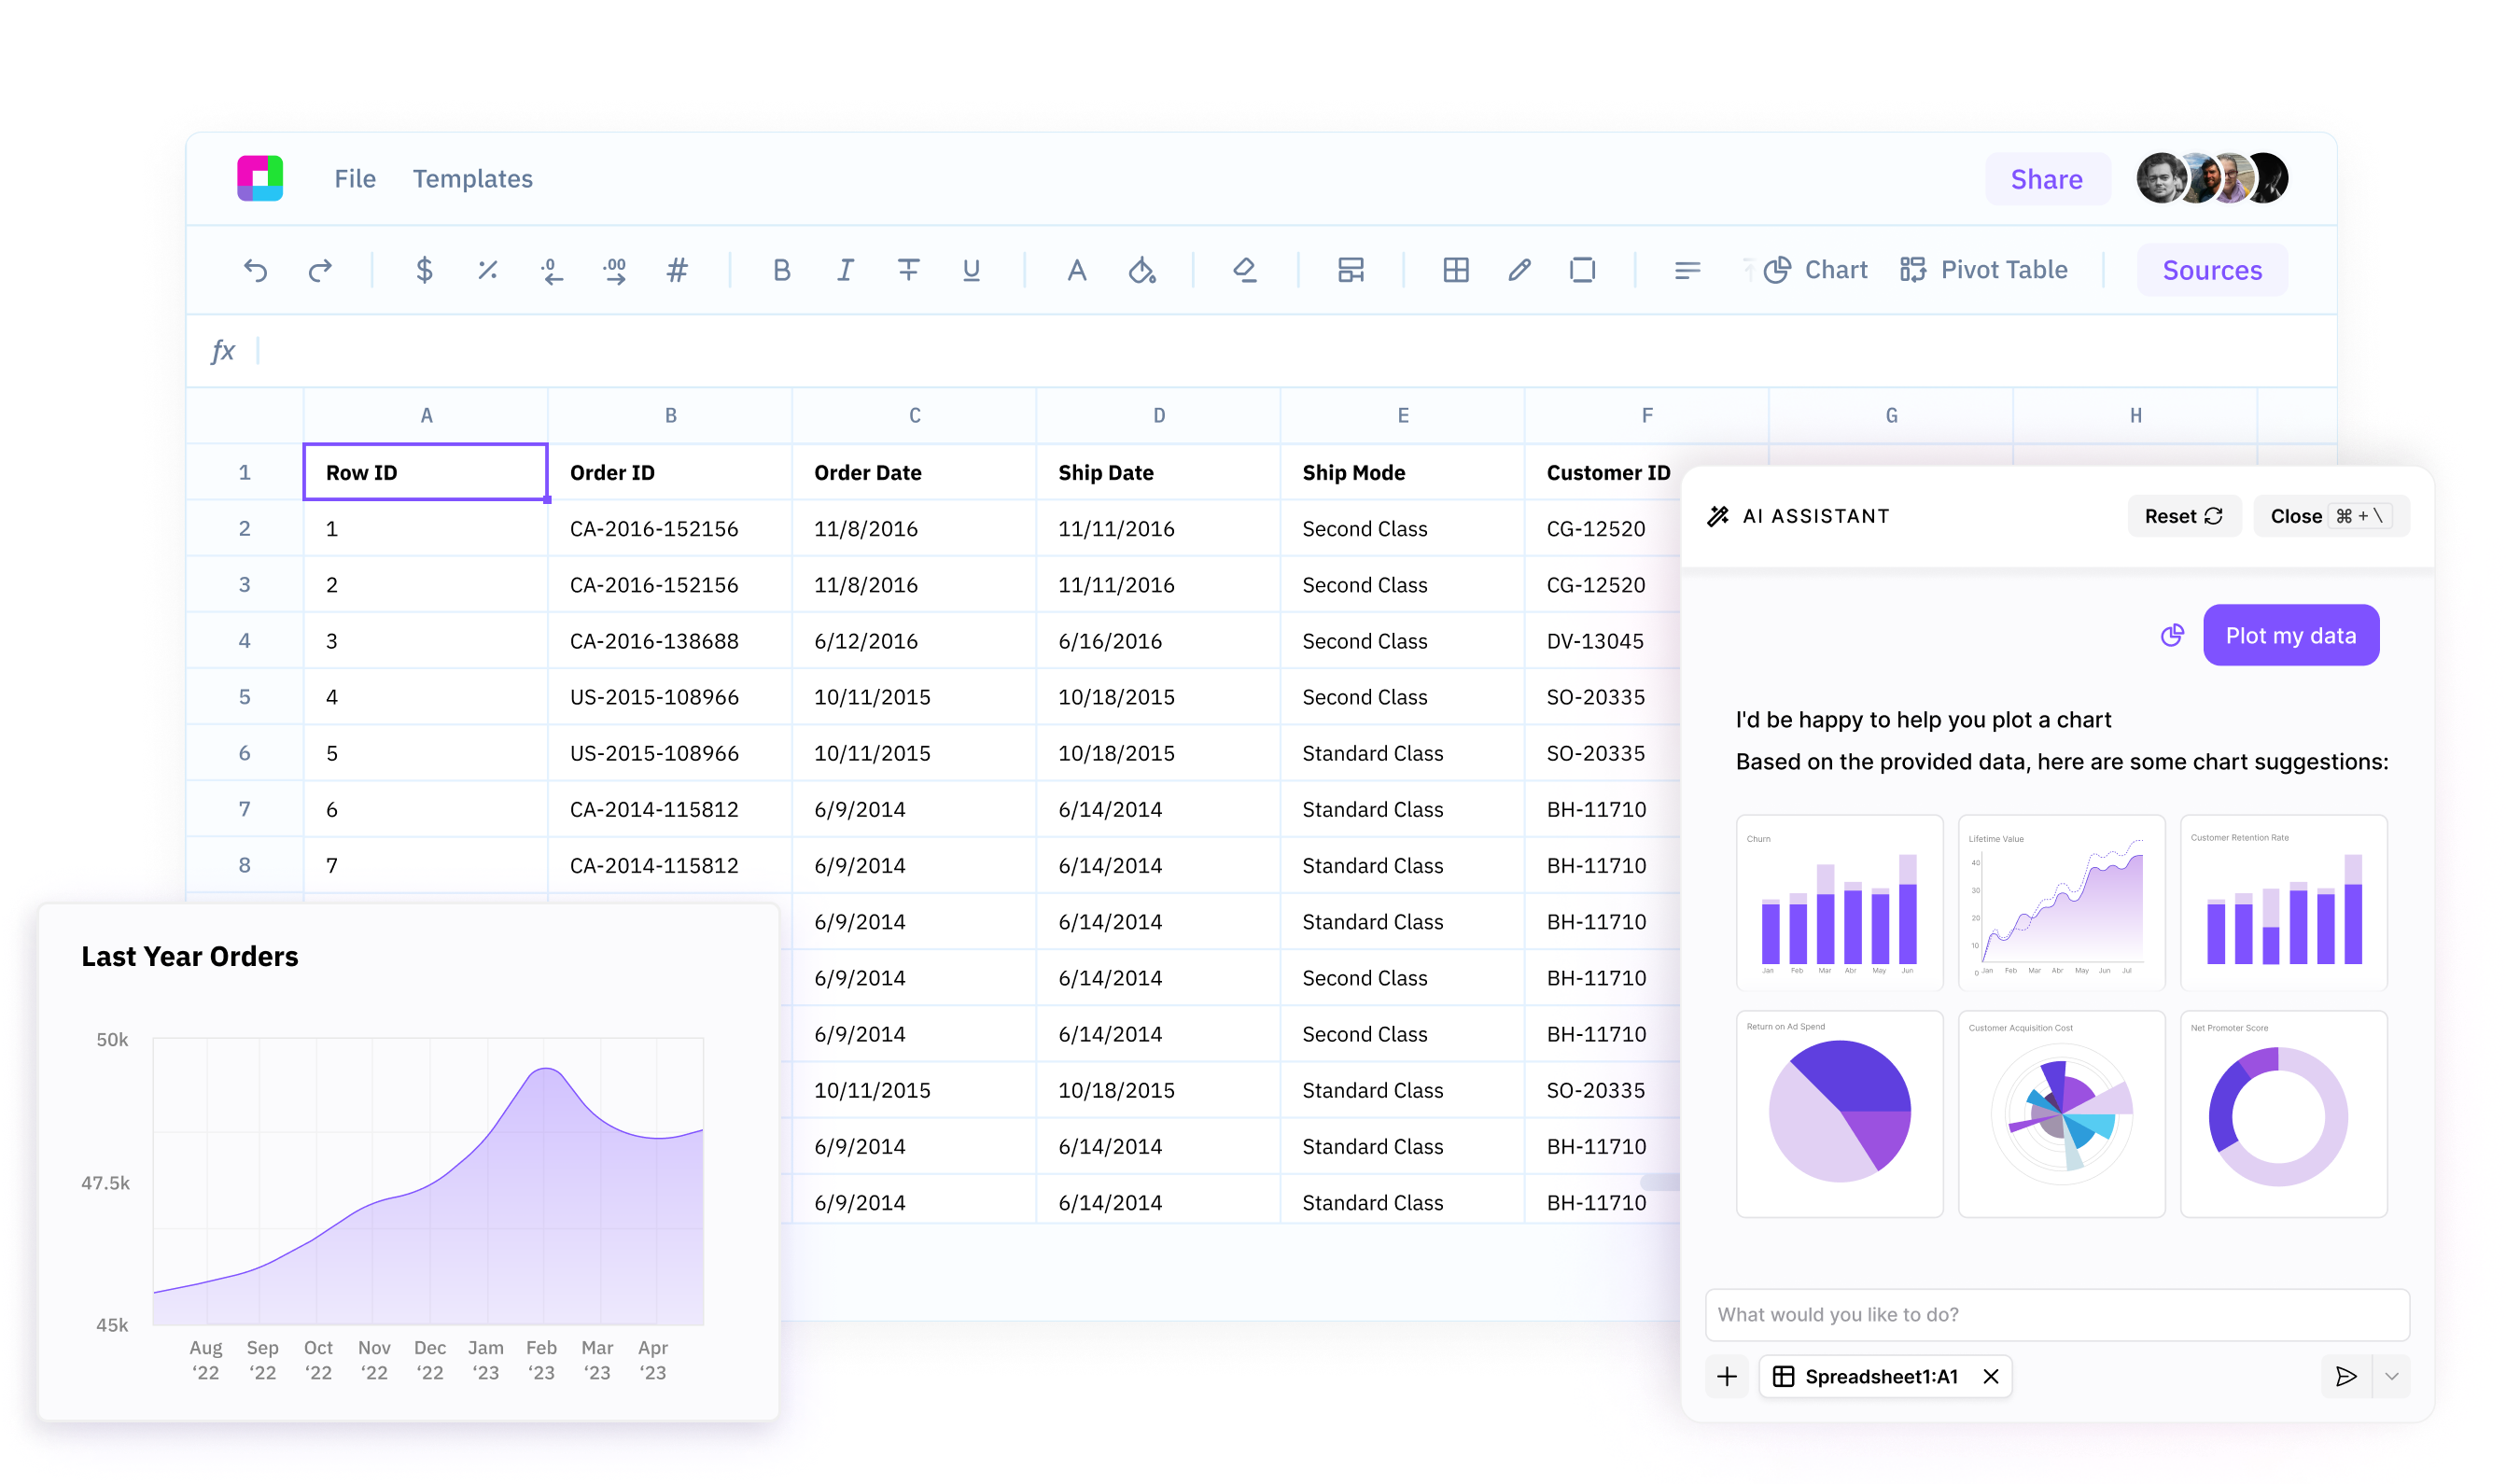
Auto-generate KPI dashboards instantly
Sourcetable's AI intelligently identifies your most important metrics and creates comprehensive KPI dashboards. Track revenue, growth, performance, and custom metrics - all generated automatically from your data.
Create interactive dashboards in minutes
Building dashboards used to take hours of design and development. Use our AI to generate professional, interactive dashboards in minutes with charts, filters, and drill-down capabilities built in.
Customize dashboards for any audience
Tailor your AI-generated dashboards to specific needs. Adjust layouts, colors, metrics, and visualizations to create executive dashboards, operational dashboards, or team-specific views that communicate insights effectively.
Your AI-Powered Dashboard Generator
Sourcetable's AI Dashboard Generator analyzes your spreadsheet data and automatically creates interactive dashboards with KPIs and insights.
Transform your data into powerful dashboards with AI
Intelligent KPI Selection
Sourcetable's AI analyzes your data to automatically identify the most important metrics and KPIs for your business. It surfaces critical insights and trends, creating dashboards that focus on what matters most to your organization.
Try for free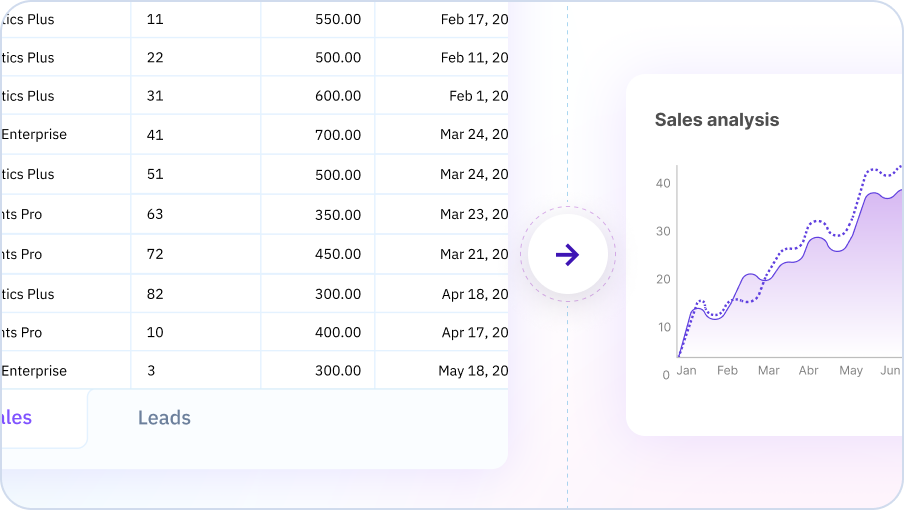
One-Click Dashboard Creation
Creating a professional dashboard is as easy as connecting your data and clicking 'Generate Dashboard'. Sourcetable's AI handles all the complex design decisions - layout, chart types, colors, filters, and more. You get stunning, ready-to-use dashboards in seconds.
Try for free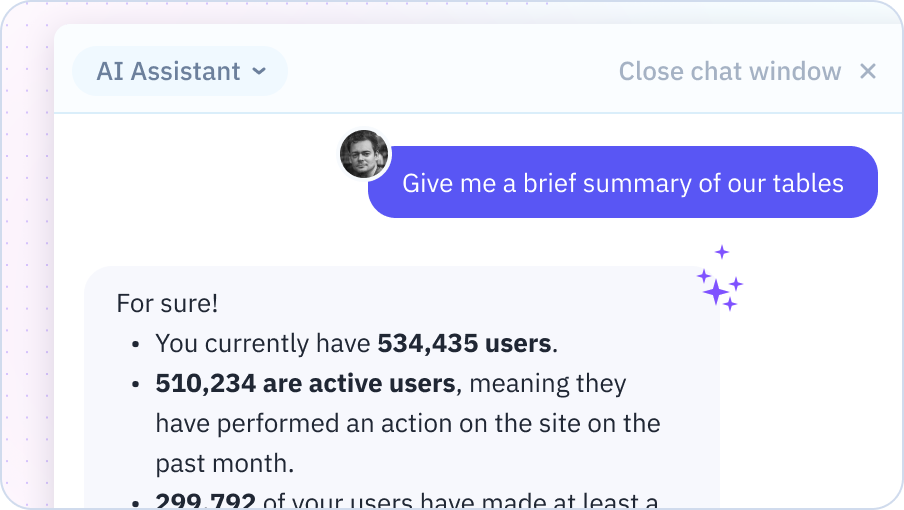
Real-Time Data Integration
Connect to live data sources and watch your dashboards update in real-time. Track metrics as they change, set up alerts for important thresholds, and always have the latest insights at your fingertips.
Try for free
Learn how to build dashboards with Sourcetable
Sourcetable's AI Dashboard Generator analyzes your spreadsheet data and automatically creates interactive dashboards with KPIs, charts, and insights. Go from raw data to executive-ready dashboards in minutes - no dashboard expertise required.

Why use Sourcetable's AI Dashboard Generator?
Make decisions faster
Get instant visibility into your key metrics and KPIs. Our AI generates dashboards that surface the insights you need to make data-driven decisions quickly.
Save time and resources
Stop spending hours building dashboards manually. Our AI creates professional, interactive dashboards in minutes, freeing your team to focus on analysis and action.
Track what matters most
Let AI identify and monitor your most important metrics. Get automated alerts when KPIs change and stay on top of your business performance effortlessly.
Empower your entire team
Make data accessible to everyone. Our AI-powered dashboards are easy to create, customize, and share, democratizing data across your organization.
Team Purple
See what people say about Sourcetable

Chris Aubuchon
@ChrisAubuchon
Spreadsheets are still the best interface for so many real world projects, it's time for @SourcetableApp to give them a reboot

Micah Alpern
@malpern
Love seeing innovation in this space after so many decades with very little.


Frequently Asked Questions
What types of dashboards can Sourcetable's AI generate?
Sourcetable's AI can generate executive dashboards, sales dashboards, marketing dashboards, financial dashboards, KPI dashboards, operations dashboards, HR dashboards, and custom dashboards for any business function. Simply describe what you want to track, and our AI will create the appropriate dashboard with relevant charts and metrics.
Can I customize the dashboards after the AI generates them?
Yes, all AI-generated dashboards are fully customizable. You can modify layouts, colors, metrics, chart types, filters, and widgets through an intuitive interface. Sourcetable's AI can also help you adjust dashboards by describing the changes you want to make in natural language.
Do I need to know which metrics to track?
No, Sourcetable's AI automatically recommends the most important KPIs and metrics based on your data and industry. If you're unsure what to track, just connect your data and our AI will suggest the key metrics that matter most to your business.
Can I connect multiple data sources to one dashboard?
Yes, you can connect multiple data sources (databases, APIs, CSV files, spreadsheets) to create unified dashboards. Sourcetable's AI handles the data integration and creates visualizations that span across all your connected sources.
How do I share dashboards with my team?
Dashboards can be shared via secure links with customizable permissions (view-only or edit access). You can also embed dashboards in websites, export them as PDFs for reports, or schedule automated email delivery to stakeholders.
Are dashboards updated in real-time?
Yes, Sourcetable dashboards can connect to live data sources and update automatically at your chosen refresh interval. You'll always see the latest data, and can set up alerts to notify you when key metrics change.