.csv
Raw Data


Capturing and quantifying Western blots or gels using chemiluminescent or fluorescent detection
Get your Amersham Imager 680 data into Sourcetable in 3 simple steps

Export your band intensity quantification and molecular weight analysis from Amersham Imager 680 via ImageQuant software to TIFF/CSV format

Import your gel imaging and quantification data into Sourcetable for comprehensive analysis

Perform automated band densitometry and gel quantification with image background correction
Amersham Imager 680 provides band intensity quantification output, molecular weight marker analysis, and automatic report generation.
.csv
Raw Data
.tiff
Image Data
Amersham Imager 680 enables gel and blot imaging workflows for protein and nucleic acid analysis applications.
Quantify band intensities and calculate relative protein or DNA concentrations
Analyze molecular weight markers and determine protein or DNA fragment sizes
Capture high-quality images for publication and laboratory documentation
The last spreadsheet you.ll ever need.
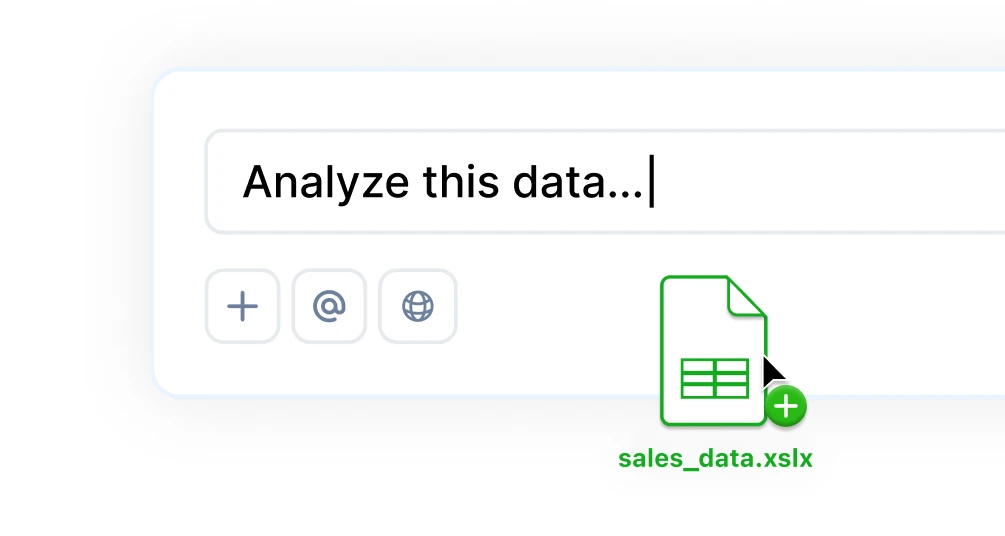
Sourcetable fuses AI smarts with Python’s full analytical power, so you can clean, query, model, and visualize data without switching tools or writing a single line of code. It’s everything you need, right where you need it.
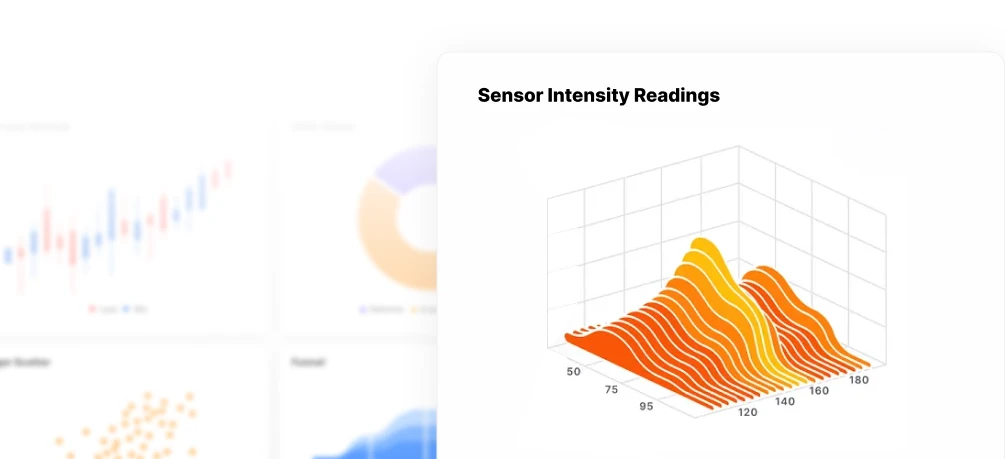
Turn data into charts & graphs instantly. Sourcetable helps you explore trends, uncover patterns, and present insights, automatically or on your terms.
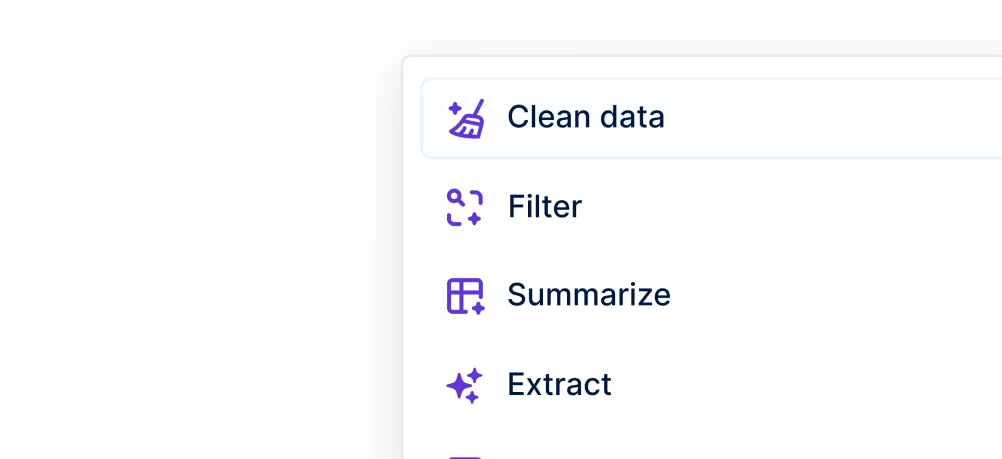
Clean, shape, and structure data with AI, formulas, or code. Sourcetable helps you go from raw input to ready-to-use datasets in seconds.
Ask questions in plain English, generate charts instantly, use Python for custom logic, and tap into built-in research tools for deeper insights.
