ALPHA II

Analyze Bruker ALPHA II FTIR Spectrometer data with AI

Compact benchtop FTIR spectrometer for routine infrared analysis

Design Features: Compact benchtop design
Specification: Plug-and-play ATR sampling
Performance: Rapid scanning capability
Control Software: OPUS Touch software integration
Specification: Built-in spectral libraries
Get Started For Free Fully compatible with Sourcetable

Quick Start Integration

Get your ALPHA II data into Sourcetable in 3 simple steps

  • Step 1

    Export Data

    Export spectral data from your ALPHA II via OPUS software to CSV format or generate PDF analysis reports

  • Step 2

    Upload to Sourcetable

    Import your FTIR spectral data and peak identification results into Sourcetable for analysis

  • Step 3

    Start Analysis

    Perform automated peak identification and generate comprehensive spectroscopic analysis reports

File Format Compatibility

Complete support for ALPHA II FTIR spectral data including peak identification and quantitative analysis for material characterization.

.csv

Raw Data

Full Support Export spectral data and analysis results Spectral data points, peak positions, library matches, quantitative results

.xlsx

Fully Formatted

Full Support Structured spectroscopic data with analysis tables Multi-component analysis, spectral comparisons, identification reports

Pre-built Analysis Workflows

Comprehensive FTIR spectroscopy workflows for material identification and quality control with automated analysis capabilities.

🔬

Material Identification

Functional group identification and library matching for unknown samples

Identification Library Functional
📊

Quantitative Analysis

Beer-Lambert law based concentration determination

Quantitative Concentration Analysis

Quality Control

Rapid material verification and purity assessment

QC Verification Purity

Technical Requirements

Software Dependencies

  • ALPHA II FTIR Compact benchtop FTIR spectrometer with ATR sampling
  • Control Software OPUS Touch software
  • File Export Format OPUS, CSV, PDF
  • Applications Pharmaceutical, polymer analysis, environmental testing

Sourcetable Libraries

  • Data Processing pandas, numpy
  • Statistical Analysis scipy, statsmodels
  • Visualization matplotlib, plotly
  • Specialized Analysis seaborn

Excel + ChatGPT + Python
=

The last spreadsheet you.ll ever need.

Data Science

Sourcetable fuses AI smarts with Python’s full analytical power, so you can clean, query, model, and visualize data without switching tools or writing a single line of code. It’s everything you need, right where you need it.
Hugging Face Hugging Face
Llama Llama
Claude Claude
Sourcetable Sourcetable
OpenAI OpenAI
*LLM’s are not trained on your data
Data Science

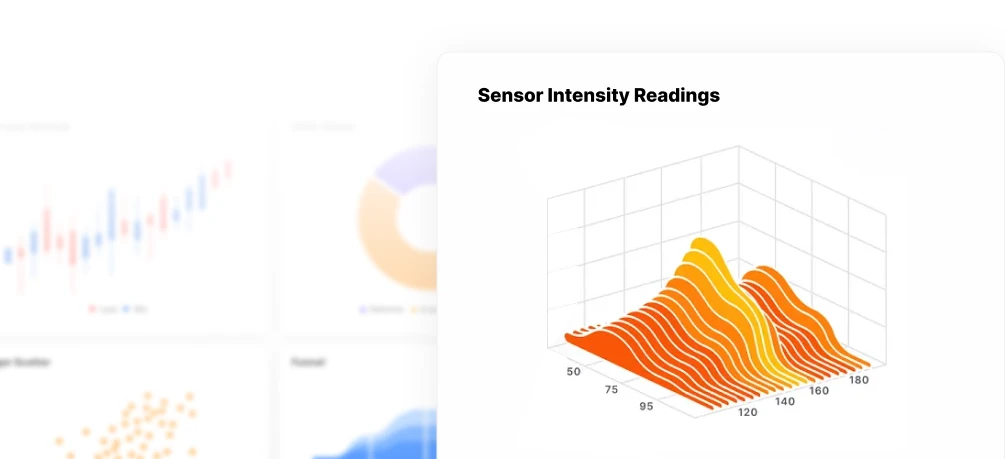
Visualizations

Turn data into charts & graphs instantly. Sourcetable helps you explore trends, uncover patterns, and present insights, automatically or on your terms.
Visualizations

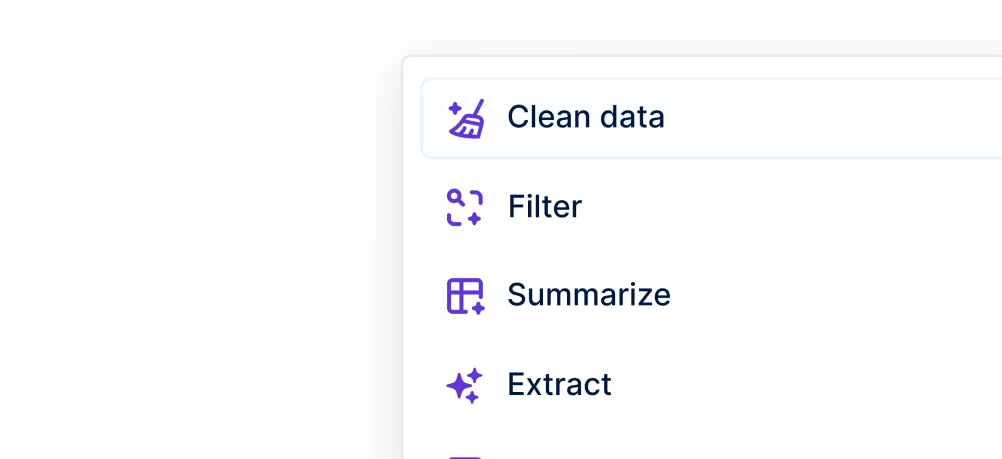
Manipulate Data

Clean, shape, and structure data with AI, formulas, or code. Sourcetable helps you go from raw input to ready-to-use datasets in seconds.
Manipulate Data

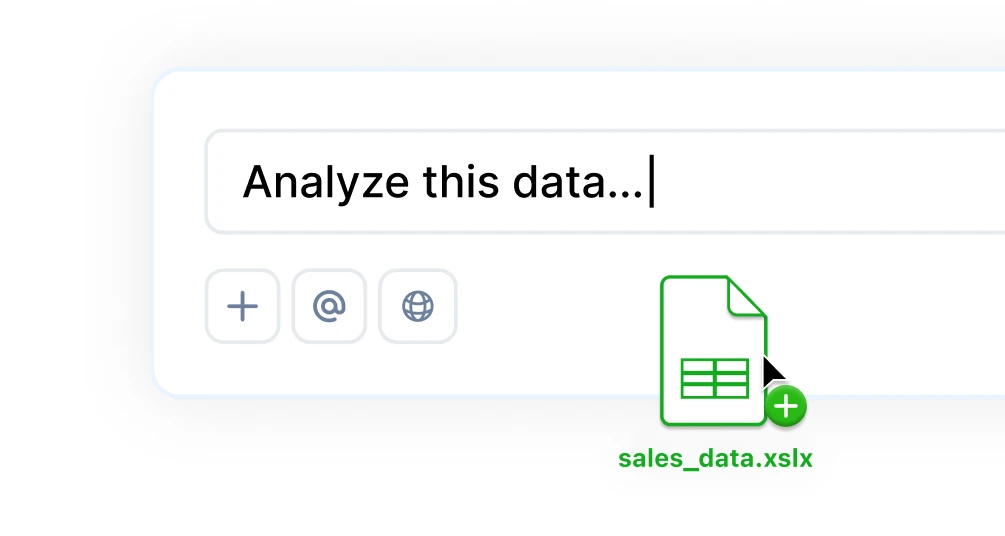
Get Insights

Ask questions in plain English, generate charts instantly, use Python for custom logic, and tap into built-in research tools for deeper insights.
Get Insights
Sourcetable Logo
Sourcetable

Experience the future of spreadsheets

Drop CSV