.csv
Raw Data


High-throughput hematology analyzer with automated slide preparation and advanced cell analysis
Get your DxH 900 data into Sourcetable in 3 simple steps

Export hematology results from your DxH 900 via LIS or middleware to CSV format

Import your hematology data into Sourcetable for comprehensive analysis

Perform automated patient result trending and QC performance monitoring
Optimized for clinical hematology with patient trending and quality control analysis
.csv
Raw Data
Clinical hematology workflows for patient analysis and laboratory management
Comprehensive CBC and differential analysis for clinical diagnostics
Patient result trend analysis and abnormal flag monitoring
Quality control performance monitoring and Levey-Jennings analysis
The last spreadsheet you.ll ever need.
Sourcetable fuses AI smarts with Python’s full analytical power, so you can clean, query, model, and visualize data without switching tools or writing a single line of code. It’s everything you need, right where you need it.

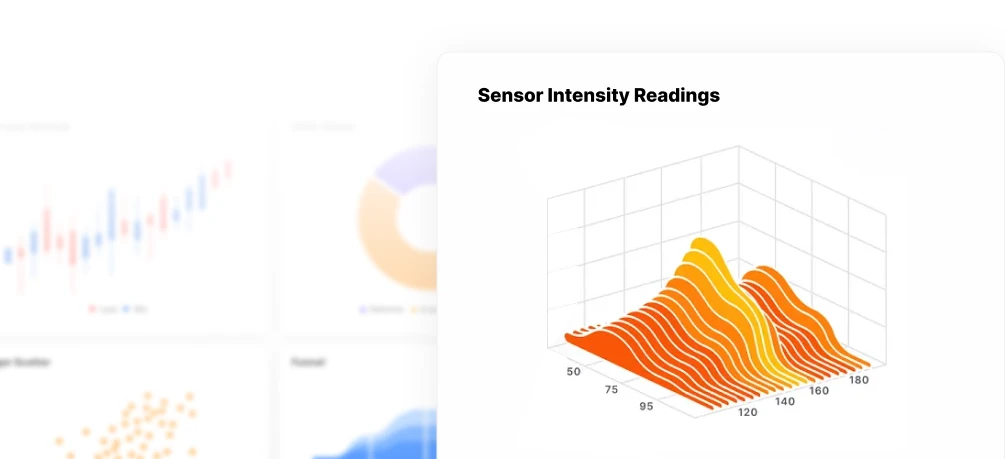
Turn data into charts & graphs instantly. Sourcetable helps you explore trends, uncover patterns, and present insights, automatically or on your terms.

Clean, shape, and structure data with AI, formulas, or code. Sourcetable helps you go from raw input to ready-to-use datasets in seconds.

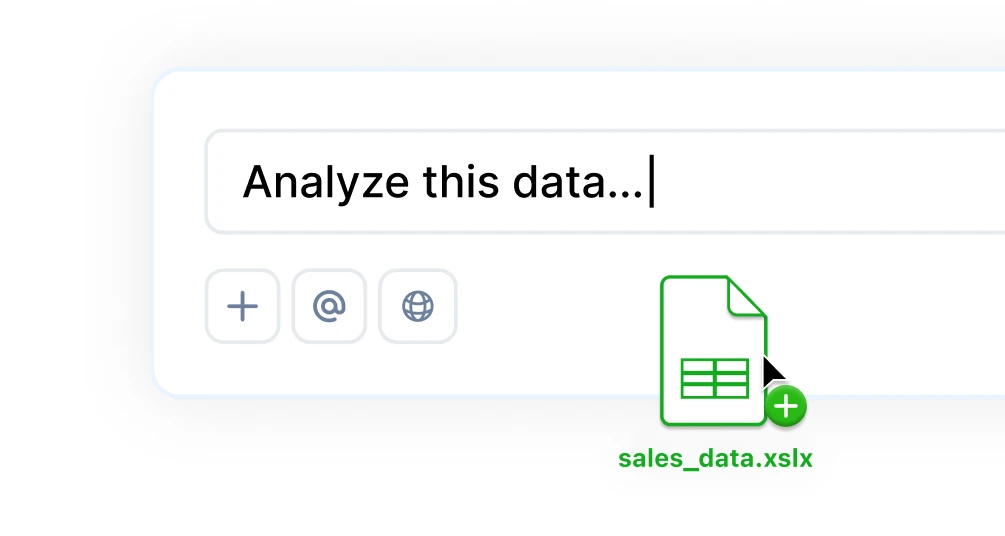
Ask questions in plain English, generate charts instantly, use Python for custom logic, and tap into built-in research tools for deeper insights.

