The ultimate fantasy sports analyst
Dominate your fantasy sports league with the same
advanced AI used by Wall Street quants and tech giants.
Get Started for free


Stay up to date with data from:


*Unofficial API support
Key uses for Sourcetable AI in fantasy sport analysis
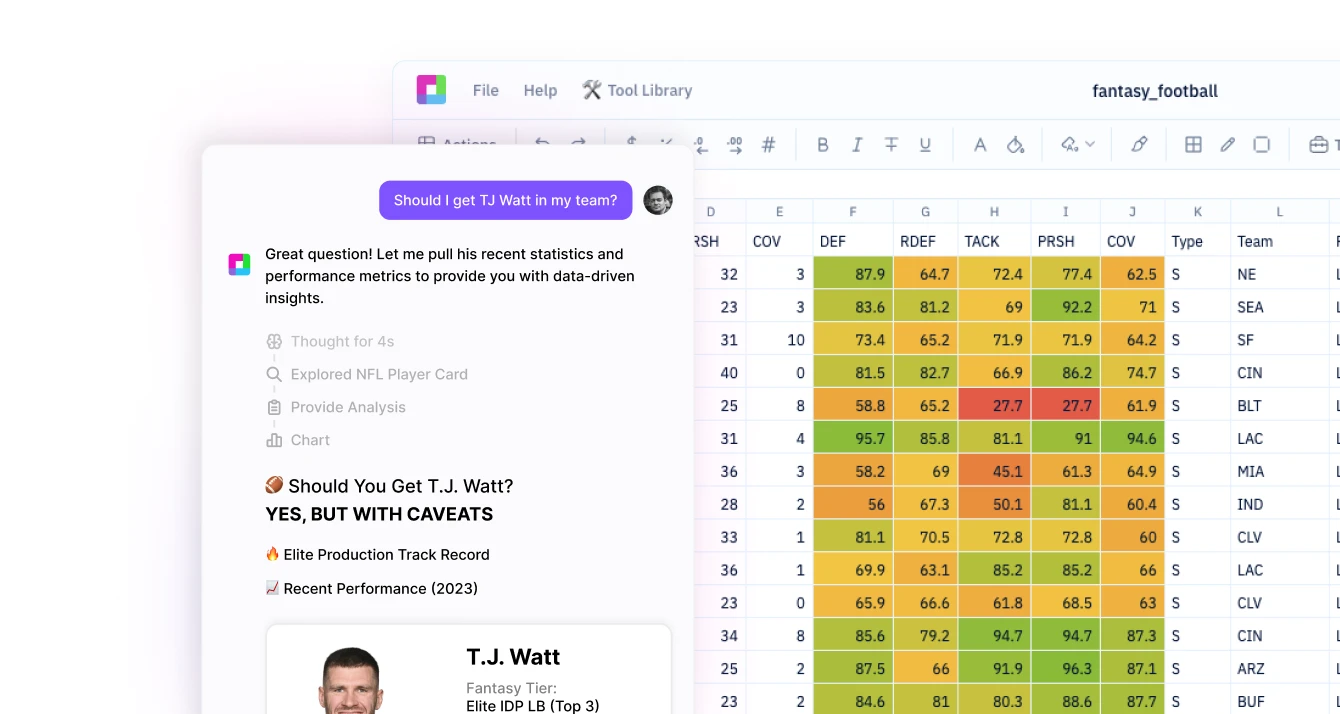
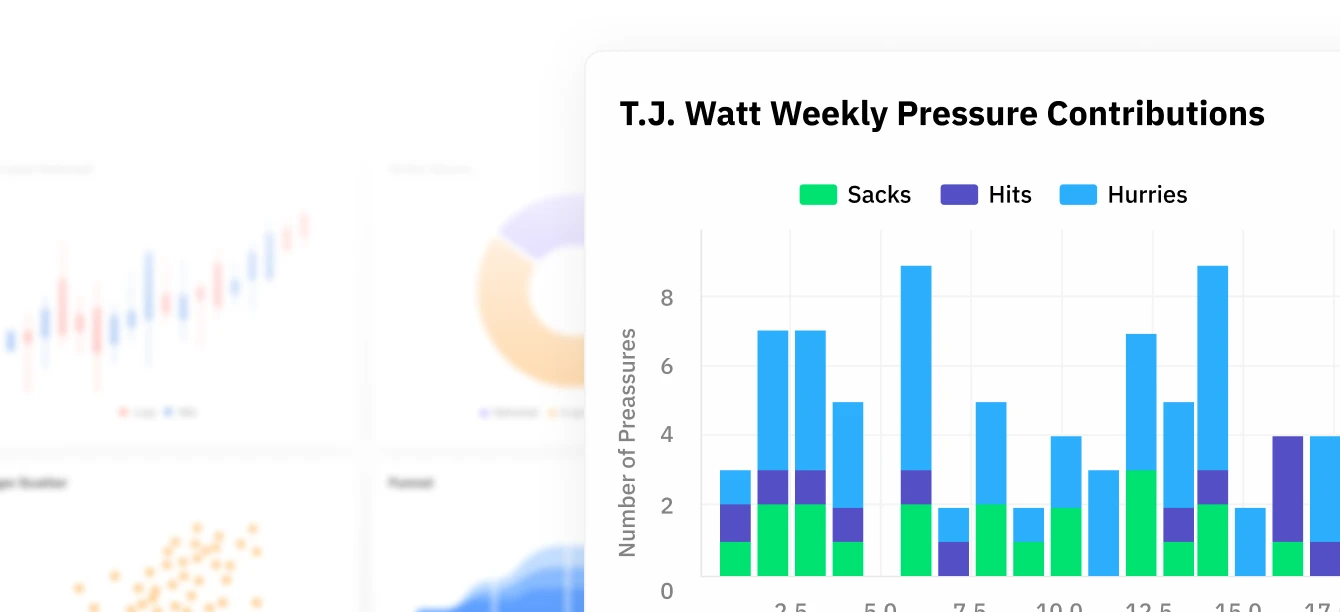
Track player performance.
Pull real-time and historical stats, efficiency metrics, and game-by-game breakdowns across positions to drive better draft, trade, and lineup decisions, without sifting through dozens of tabs.
Break down matchups.
Understand opponent strengths, game flow, weather, and scheduling impacts to predict performance trends, without spending hours modeling every variable manually.
Uncover fantasy value.
Highlight under-the-radar picks, price shifts, and buy-low/sell-high targets using ownership data, projections, and historical deltas, giving you a smarter edge every week.
Use all the top data analysis tools, without code
“Sourcetable is so simple and so powerful.
It almost feels like cheating.”
What else can Sourcetable do?

Fantasy Sports Management made simple
Analyze, visualize, and optimize your fantasy sports strategy with AI-powered spreadsheets. Instantly access player stats, automate projections, and make smarter decisions for MLB, FPL, NBA, and more—all in one place.
-
Fantasy Premier League
Dominate Fantasy Premier League by tracking player xG, fixture difficulty, and injury updates. Automate transfer planning and captaincy choices with up-to-date EPL data.

-
Cricket Fantasy League
Gain an edge in fantasy cricket, track player form, and analyze team strategies. Build custom dashboards for points, runs, and wickets.

-
NBA
Stay ahead in NBA fantasy leagues, monitor player usage rates, injury reports, and back-to-back schedules. Build custom dashboards for points, rebounds, assists, and advanced stats.

-
Major League Baseball
Dive into Major League Baseball data, analyze batting averages, pitching stats, and player splits to optimize your fantasy baseball roster and make smarter waiver wire moves.

-
Formula 1
Stay ahead in Formula 1 fantasy leagues, monitor driver performance, and analyze team strategies. Build custom dashboards for points, wins, and pole positions.

Excel + ChatGPT + Python
=
The last spreadsheet you'll ever need.
Get Insights
Ask questions in plain English, generate charts instantly, use Python for custom logic, and tap into built-in research tools for deeper insights.
Visualizations
Turn data into charts & graphs instantly. Sourcetable helps you explore trends, uncover patterns, and present insights, automatically or on your terms.
Sports Focused Data Science
Sourcetable fuses AI smarts with Python’s full analytical power, so you can clean, query, model, and visualize data without switching tools or writing a single line of code. It’s everything you need, right where you need it.


Stock Market Analysis
Quant helps you plan, research, and analyze markets with macro models, portfolio balancing, advanced stock analysis, crypto, and Python-based integrations. Powered by the latest AI models.
Frequently Asked Questions
If your question is not covered here, you can contact our team.
Contact UsHow do I analyze data?
What data sources are supported?
What data science tools are available?
Can I analyze spreadsheets with multiple tabs?
Can I generate data visualizations?
What is the maximum file size?
Is this free?
Is there a discount for students, professors, or teachers?
Is Sourcetable programmable?
Sourcetable
Experience the future of spreadsheets