Interactive Visualizations
Share visually striking dashboards with the team.

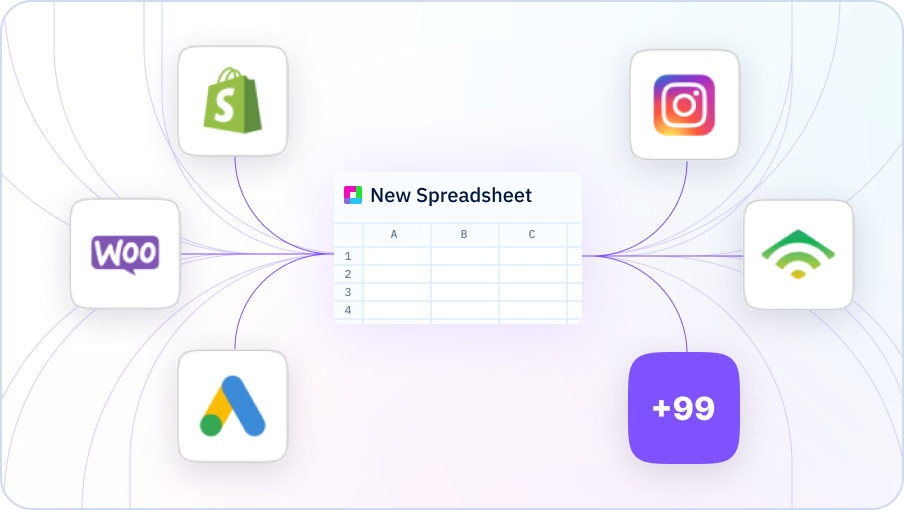
Connect to your data
Sourcetable makes it simple to use spreadsheet formulas to connect any data source, like Stripe, Shopify, or MySQL and over 100+ applications and databases.
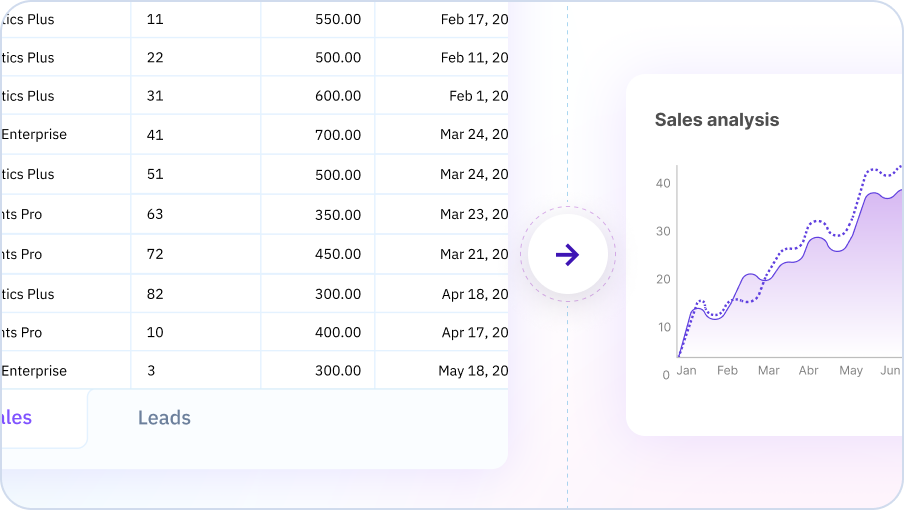
Live dashboards
Align your team with auto-updating charts that are always up-to-date. Choose from many types of visualizations including charts, graphs, and conditional formatting to get the look and feel that works for your team’s needs.
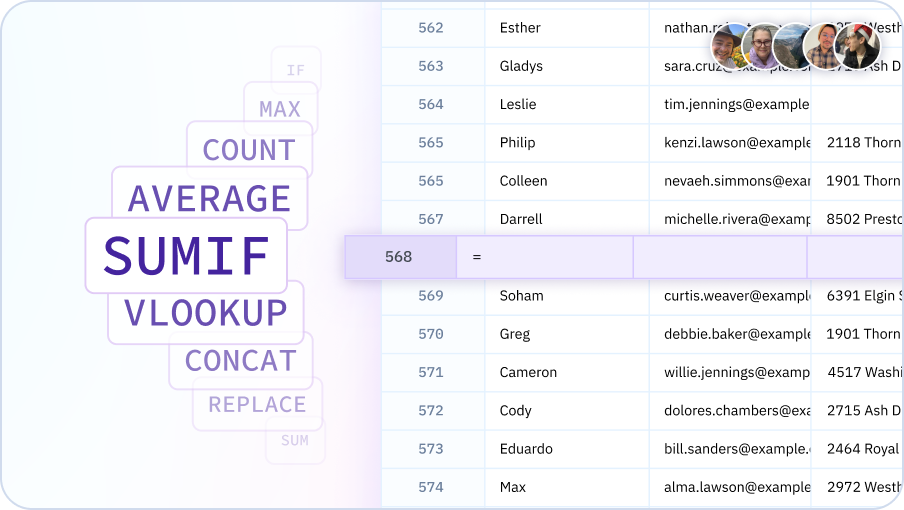
Data collaboration using the tool you know: spreadsheets
Sourcetable has all the formulas you expect from Excel and and Google Sheets. There’s no need to learn how to code or write SQL. Everyone on your team can share data and insights, with ease.

Send daily, weekly, or monthly charts via email or slack
With Sourcetable, you also get advanced reporting capabilities. Just one click can send an automatically generated chart by email or slack on a daily, weekly or monthly basis.
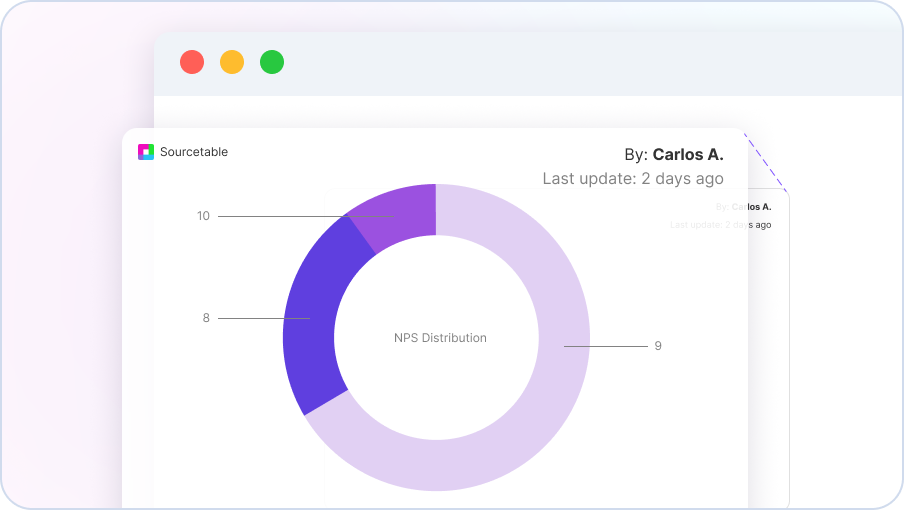
Embed interactive visualizations
With Sourcetable’s publishing capabilities, you can embed live-updating visualizations into documents, blogs, websites, and even your own product.
Who Is this good for?
💪 Managers - Align your team behind the metrics that matter.
💸 Sales - Drill down on your sales pipeline by sales rep or region.
📈 Data Analyst - Create live dashboards to track your marketing spend and campaign performance. Great for reporting ROAS, Conversion, CAC, LTV, Churn
🚀 Finance - See the state of your business with a live operating model that is always up to to date. Sync important data from QuickBooks, Stripe, databases, marketing tools, and more.
🏢 Startups - Sourcetable is a turnkey Business Intelligence solution. Setup auto-updating charts and dashboards to track the state of your business. No engineers required.
Frequently Asked Questions
How does Sourcetable make it easy to create charts and graphs?
What types of visualizations does Sourcetable offer?
How many integrations does Sourcetable have?
What data integrations can I connect to my spreadsheet?
What kind of insights can I gain from Sourcetable?
What data sources can I connect to Sourcetable?
What type of data can I connect with Sourcetable?
What kinds of reports can I generate with Sourcetable?
Is the data in Sourcetable live?
Make Better Decisions
With Data
Analyze data, automate reports and create live dashboards
for all your business applications, without code.