Introduction
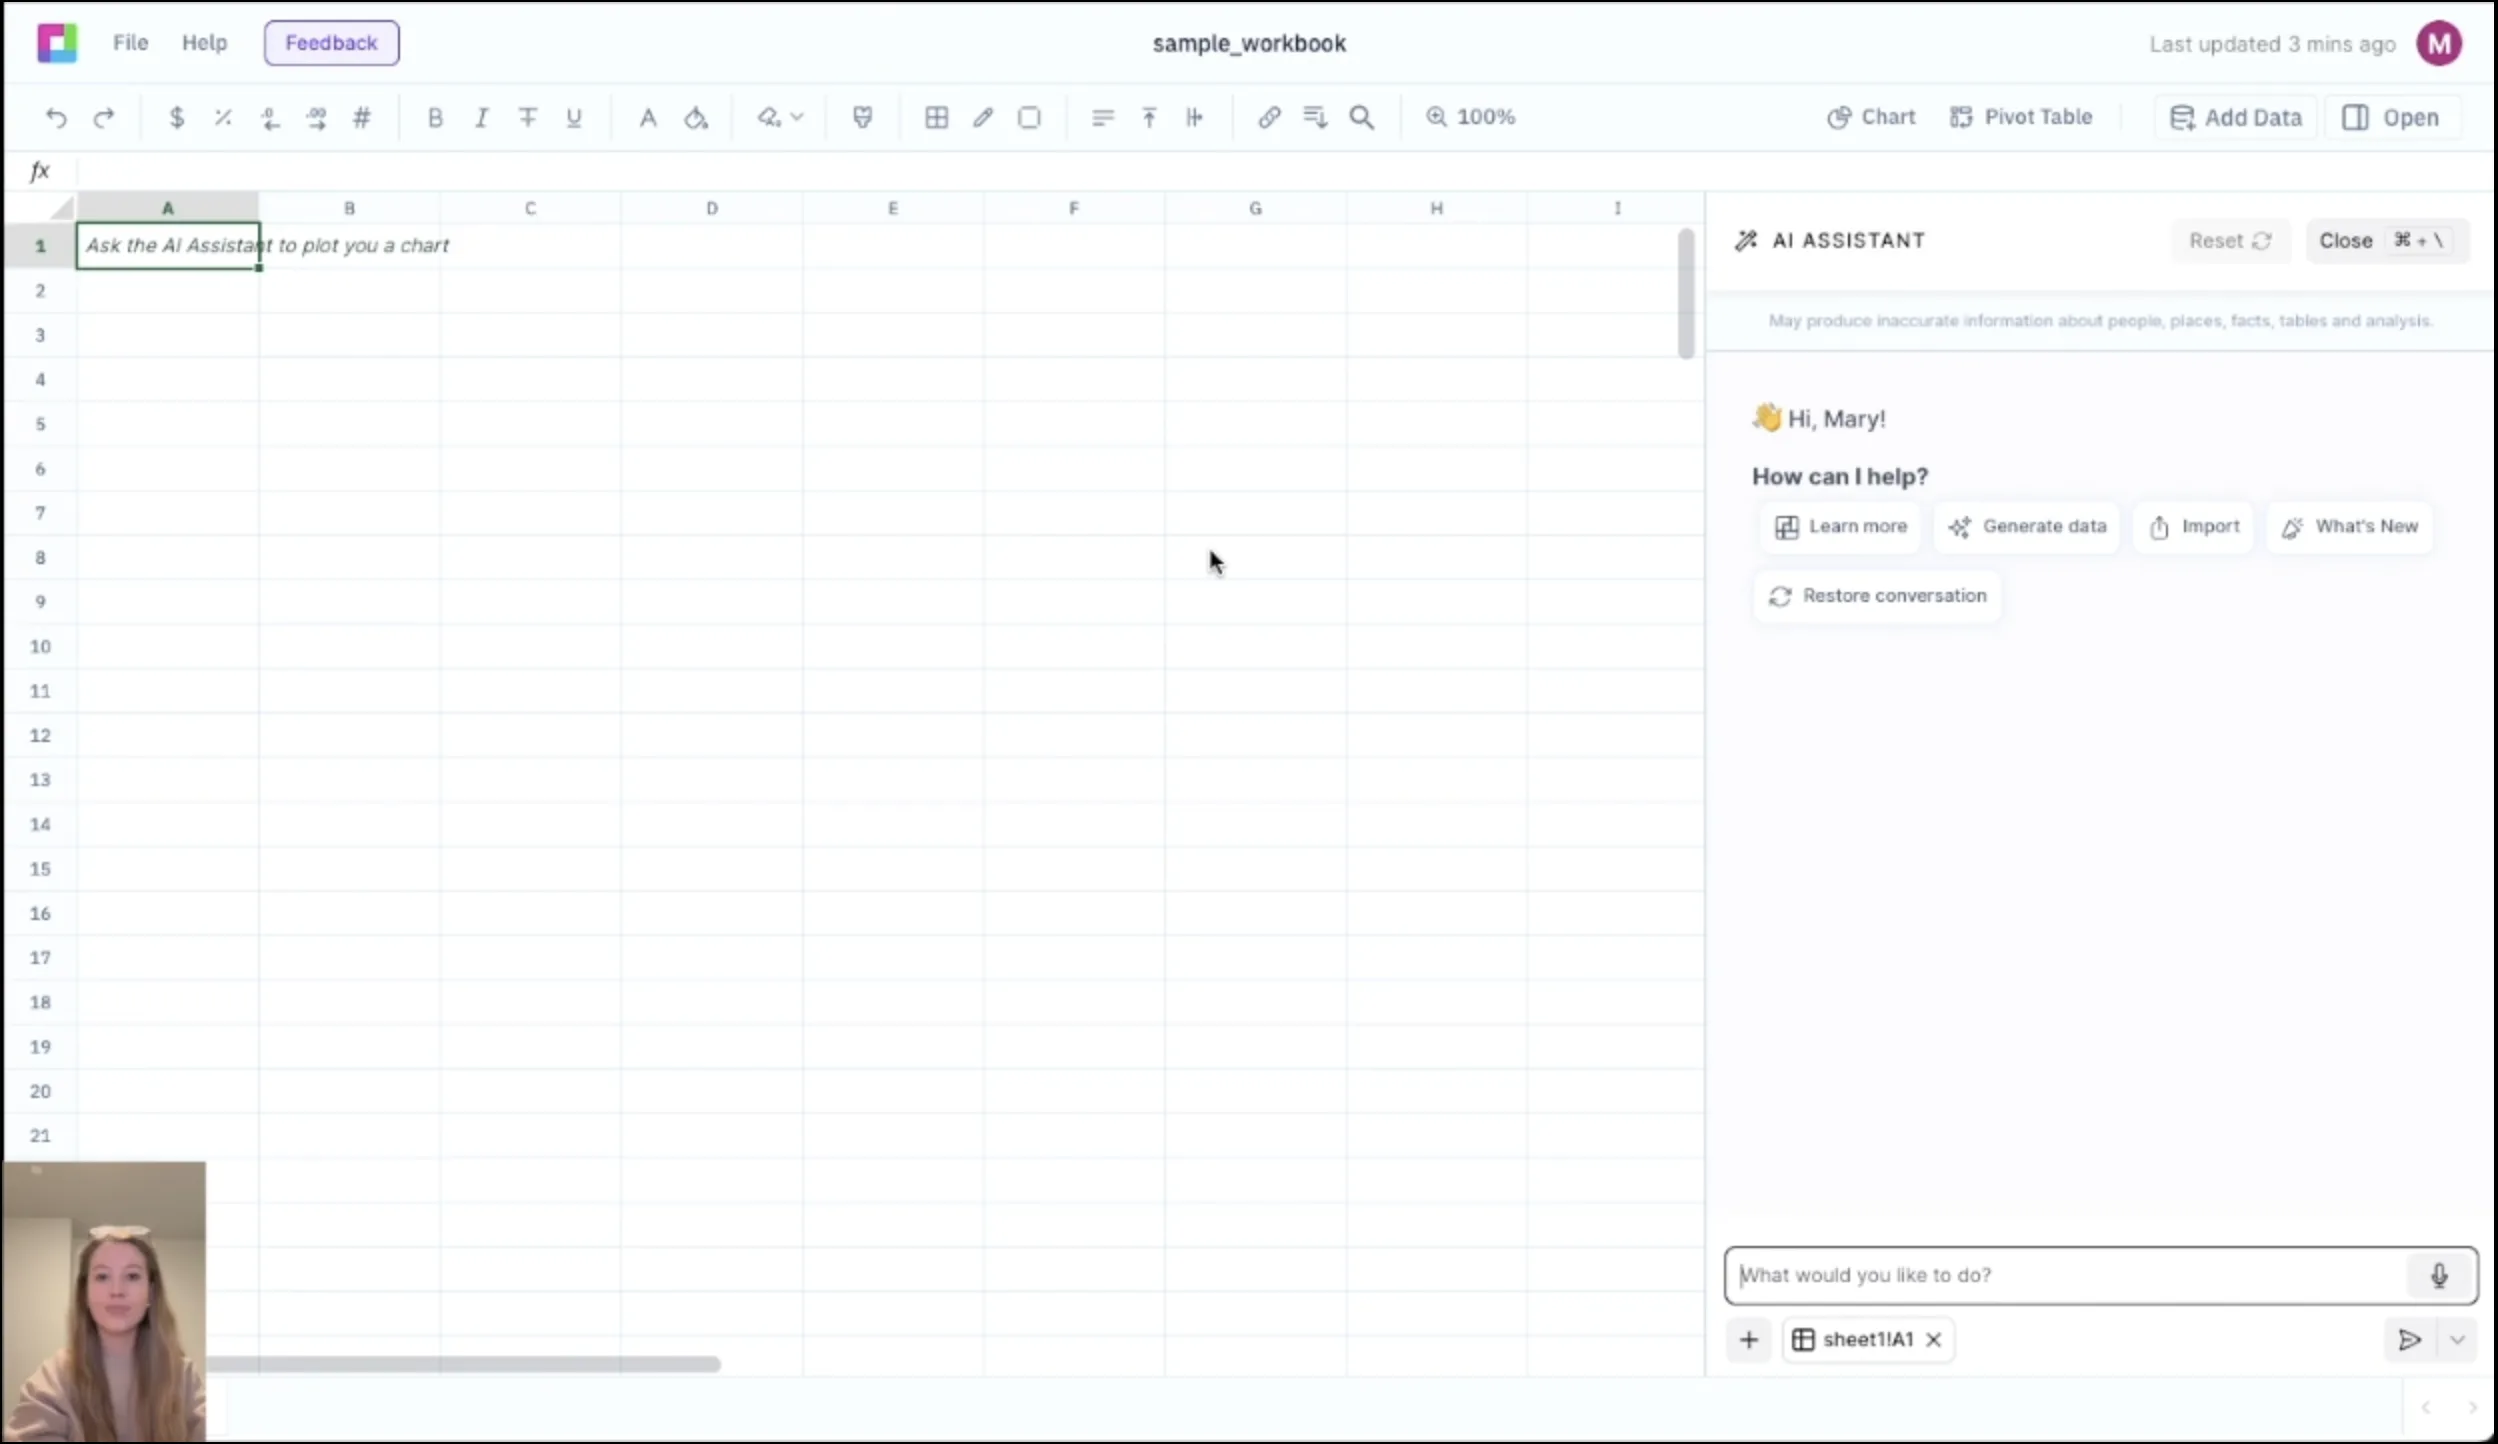
Sourcetable's Comparison Chart Excel Template Generator combines artificial intelligence with spreadsheet functionality to streamline data visualization. This powerful tool merges Excel's computational capabilities with ChatGPT's natural language processing, enabling users to create professional comparison charts through simple text commands.
In this guide, we'll explore how Sourcetable empowers you to generate customized Comparison Chart Excel templates, which you can try it free.
What is a Comparison Chart Excel Template?
A Comparison Chart Excel template is a pre-formatted spreadsheet tool designed to compare multiple items, products, or data points across various criteria. These templates streamline decision-making processes by organizing information in a clear, visual format.
Using Sourcetable, an AI-powered spreadsheet platform, you can generate customized Comparison Chart templates instantly. The platform can create templates for various comparison scenarios, including:
Template Types Available Through Sourcetable
• Product feature comparisons
• Pricing analysis matrices
• Vendor evaluation charts
• Service provider comparisons
• Competition analysis frameworks
• Performance metric comparisons
• Cost-benefit analysis tables
Each template includes customizable columns, rows, formatting options, and built-in calculation formulas for quantitative comparisons. Sourcetable's AI capabilities ensure templates adapt to specific business needs while maintaining professional spreadsheet standards.
Generate Custom Comparison Charts with Sourcetable
Sourcetable combines Excel's power with ChatGPT's natural language capabilities, revolutionizing how you create comparison charts. This AI-powered spreadsheet tool lets you generate custom templates through simple conversational commands.
Unlike traditional spreadsheet software, Sourcetable understands plain English requests, eliminating the need for complex formulas or manual formatting. Simply describe your comparison chart requirements, and watch as Sourcetable creates a professional template instantly.
Transform your spreadsheets into stunning visual comparisons with Sourcetable's automated chart generation. The platform's AI technology ensures accurate data organization while maintaining the flexibility to customize every aspect of your comparison charts.
Benefits of Using a Comparison Chart Excel Template
A Comparison Chart Excel template streamlines data analysis by providing a pre-built framework for comparing products, services, or metrics. These templates eliminate manual formatting, reduce errors, and ensure consistent data presentation across your organization.
Key Advantages of Excel Comparison Templates
Excel comparison templates offer built-in formulas, conditional formatting, and customizable layouts that save hours of setup time. Users can quickly input data, generate visual comparisons, and make informed decisions based on standardized criteria.
Generating Charts with Sourcetable
Sourcetable's AI-powered platform transforms spreadsheet creation through natural language processing. Users can create comparison charts instantly by describing their needs in plain English, bypassing complex Excel functions and manual template design.
This AI-driven approach accelerates workflow by automatically generating appropriate formulas, formatting, and chart structures. Sourcetable eliminates the learning curve associated with Excel functions while maintaining professional-grade output quality.
AI-Generated Comparison Chart Templates in Sourcetable
Product Comparison Charts
Create detailed product comparison matrices that automatically display pricing, features, and specifications across multiple items. Generate side-by-side analyses of competitor offerings with customizable columns for metrics like dimensions, materials, and customer ratings.
Financial Comparison Tables
Build dynamic financial comparison sheets that calculate and display key metrics across different investments, assets, or time periods. Compare ROI, revenue growth, and profit margins with automated formulas and conditional formatting.
Performance Metric Charts
Design KPI comparison tables that track and visualize performance metrics across teams, departments, or business units. Generate heat maps and color-coded cells to highlight variances and achievements against targets.
Feature Comparison Templates
Develop comprehensive feature comparison matrices for software, services, or subscription plans. Create checkmark-based comparison charts that clearly display included features across different tiers or packages.
Cost Analysis Tables
Generate detailed cost comparison sheets that break down expenses, pricing tiers, and total ownership costs. Compare vendor quotes, service plans, or project budgets with automated calculations and percentage differentials.
Comparison Chart Template Use Cases
Frequently Asked Questions
What is a Comparison Chart Excel template?
A Comparison Chart Excel template is a pre-formatted spreadsheet designed to help users compare and analyze different items, products, or data points side by side in a visual format.
What can you do with a Comparison Chart template?
With a Comparison Chart template, you can create visual comparisons of products, services, or data points, analyze differences and similarities between items, and present comparative information in an organized, easy-to-understand format.
How can you generate a Comparison Chart template?
You can quickly generate a Comparison Chart template using Sourcetable, an AI-powered spreadsheet tool. Sourcetable allows you to create templates using natural language commands, making it faster and more efficient than traditional Excel template creation.
Conclusion
Sourcetable's Comparison Chart Excel Template Generator revolutionizes spreadsheet creation by combining Excel's functionality with ChatGPT's natural language processing. This AI-powered tool streamlines the process of creating complex comparison charts, saving time and reducing errors. Generate professional templates effortlessly with natural language commands and enhance your data visualization capabilities.
Transform your spreadsheet workflow today and experience the future of data comparison analysis with Sourcetable. Try it free and discover how AI-driven spreadsheet generation can elevate your productivity.
Recommended Excel Templates
Frequently Asked Questions
If you question is not covered here, you can contact our team.
Contact Us


