Analyze MSCI Hong Kong data with AI
Sourcetable's AI is the smartest way to analyze market data. Built for Financial Analysts, Traders & Portfolio Managers, it's your AI-native Bloomberg-alternative.

Our Impact
~70
Hong Kong Companies
HK$15T
Total Market Cap
90%
Time Savings vs Excel
5 Min
Complete Analysis Time
Why Choose Sourcetable for MSCI Hong Kong Index Analysis?
Combine the power of Excel with advanced AI to analyze Hong Kong stocks like never before
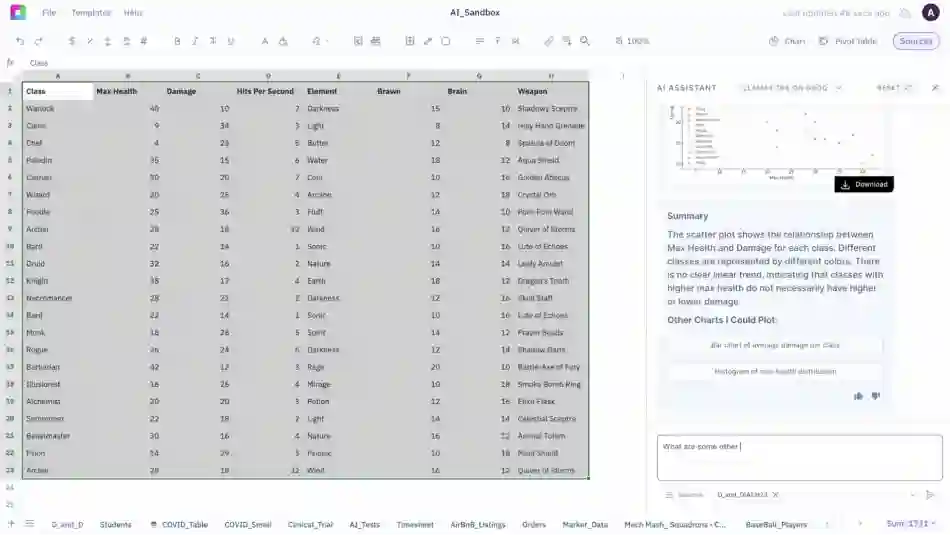
AI-Powered Analysis
Ask questions in plain English: "Which MSCI Hong Kong stocks have the highest dividend yields?" Get instant answers with automated calculations and visual insights.
MSCI Hong Kong Data Analysis
Import and analyze MSCI Hong Kong data. Track index performance, constituent weights, sector allocations, and market cap distribution with comprehensive historical data covering Hong Kong equities.
Instant Insights
Generate sector comparisons, risk assessments, and performance rankings in seconds. No more manual data entry or complex formula building.
Advanced Visualizations
Create professional charts, heat maps, and dashboards automatically. Export presentation-ready reports for clients or stakeholders.
Smart Screening
Filter MSCI Hong Kong constituents by any criteria: sector performance, dividend yields, valuation metrics, currency exposure, and China revenue contribution.
Risk Analysis
Calculate portfolio risk, correlation matrices, and volatility measures across MSCI Hong Kong holdings with enterprise-grade accuracy.
Sourcetable tools for Stock Analysis
Whether you're tracking stocks or exploring new ideas, Sourcetable brings everything together, market data, your own files, and even insights from across the web.

Yahoo Finance
Access live market data, historical prices, and key metrics directly from Yahoo Finance. All without leaving your spreadsheet.

Financial Tools
Analyze fundamentals, technicals, sentiment, and more using Sourcetable's rich library of built-in AI finance tools.

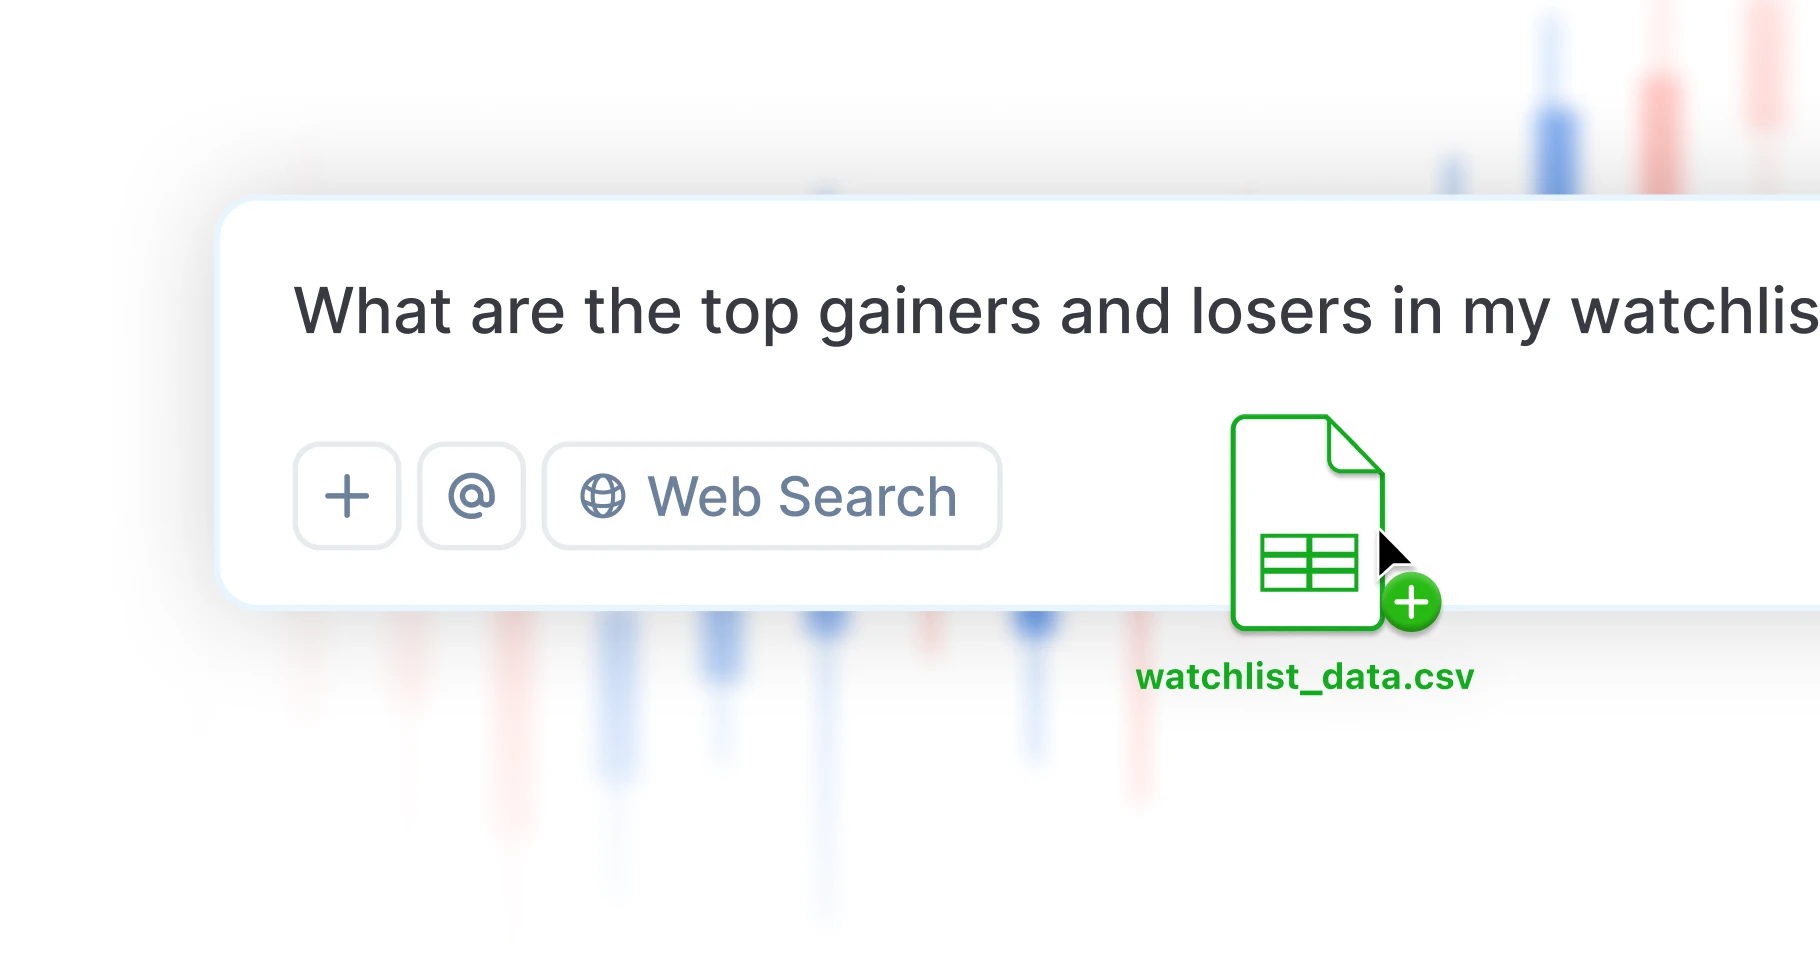
CSV/XLSX Analysis
Import your own spreadsheets and get instant insights using formulas, visualizations, and AI-powered analysis tools.

Market Analysis Tools
Plan, research, and analyze markets inside Sourcetable with macro trading models, portfolio balancing, and advanced stock analysis. making complex strategies easier to design, test, and compare.
Code with AI
Run advanced financial analysis and research with natural language and Python-powered models.

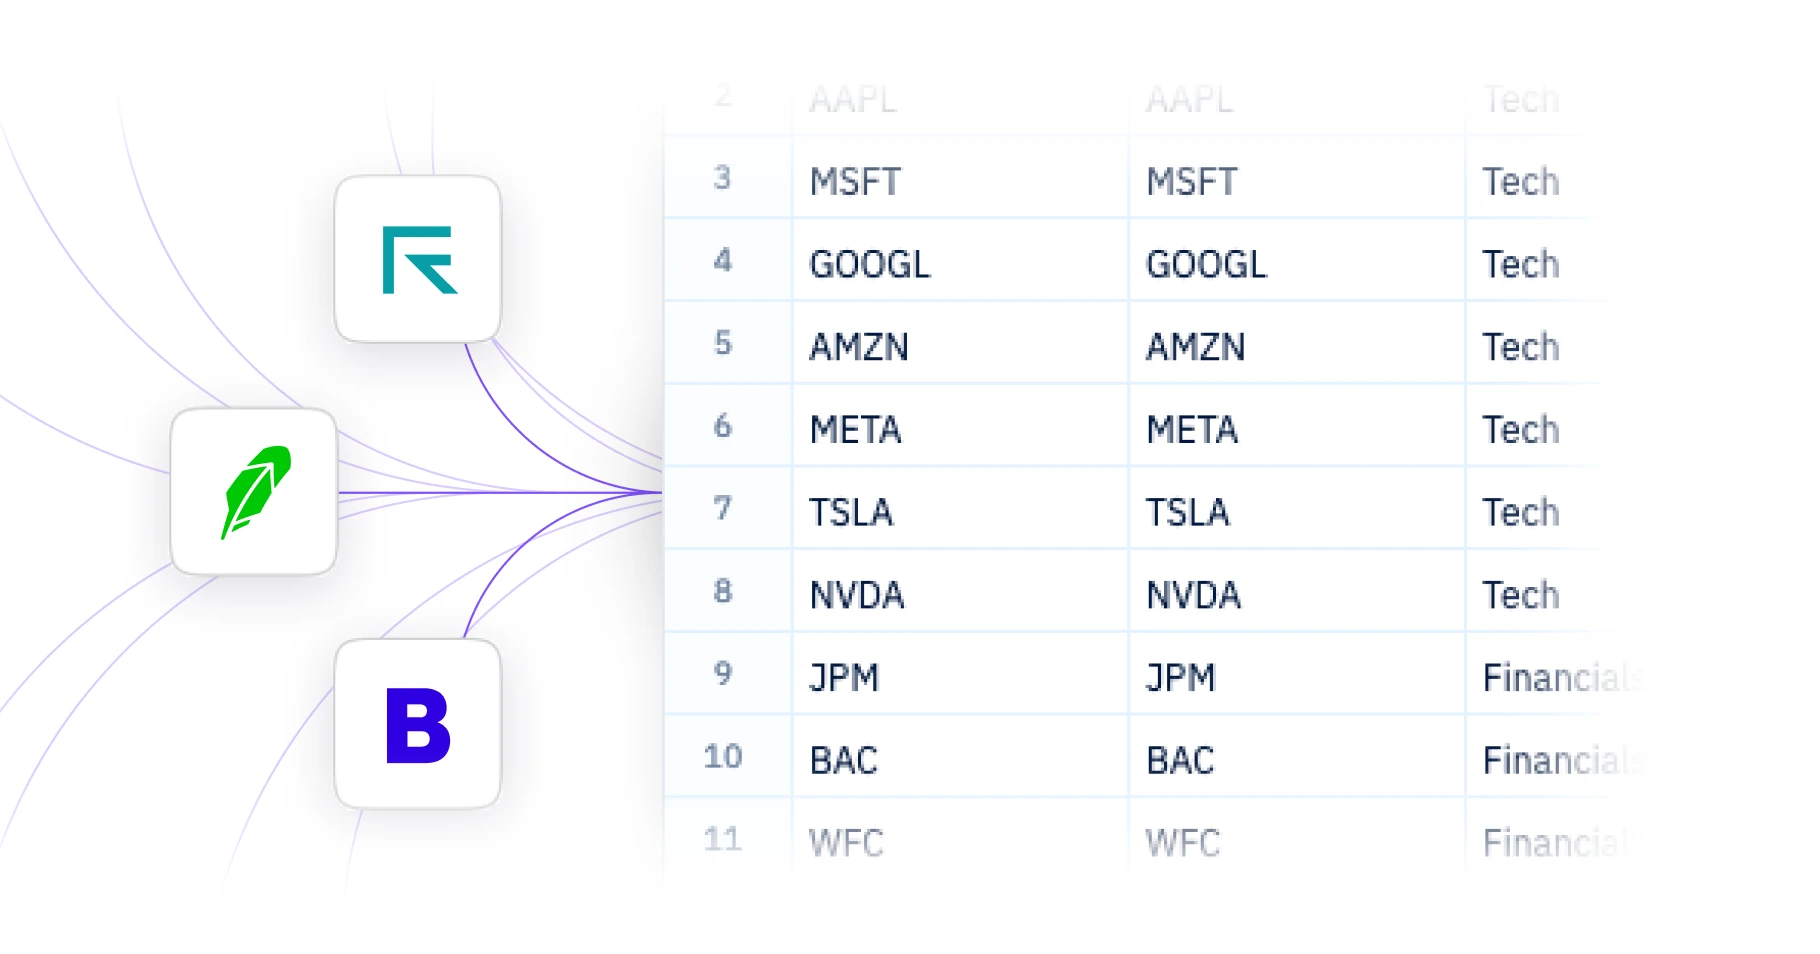
Stay Connected
Connect brokerages, exchanges, data providers, and databases into one workflow via Superagents.
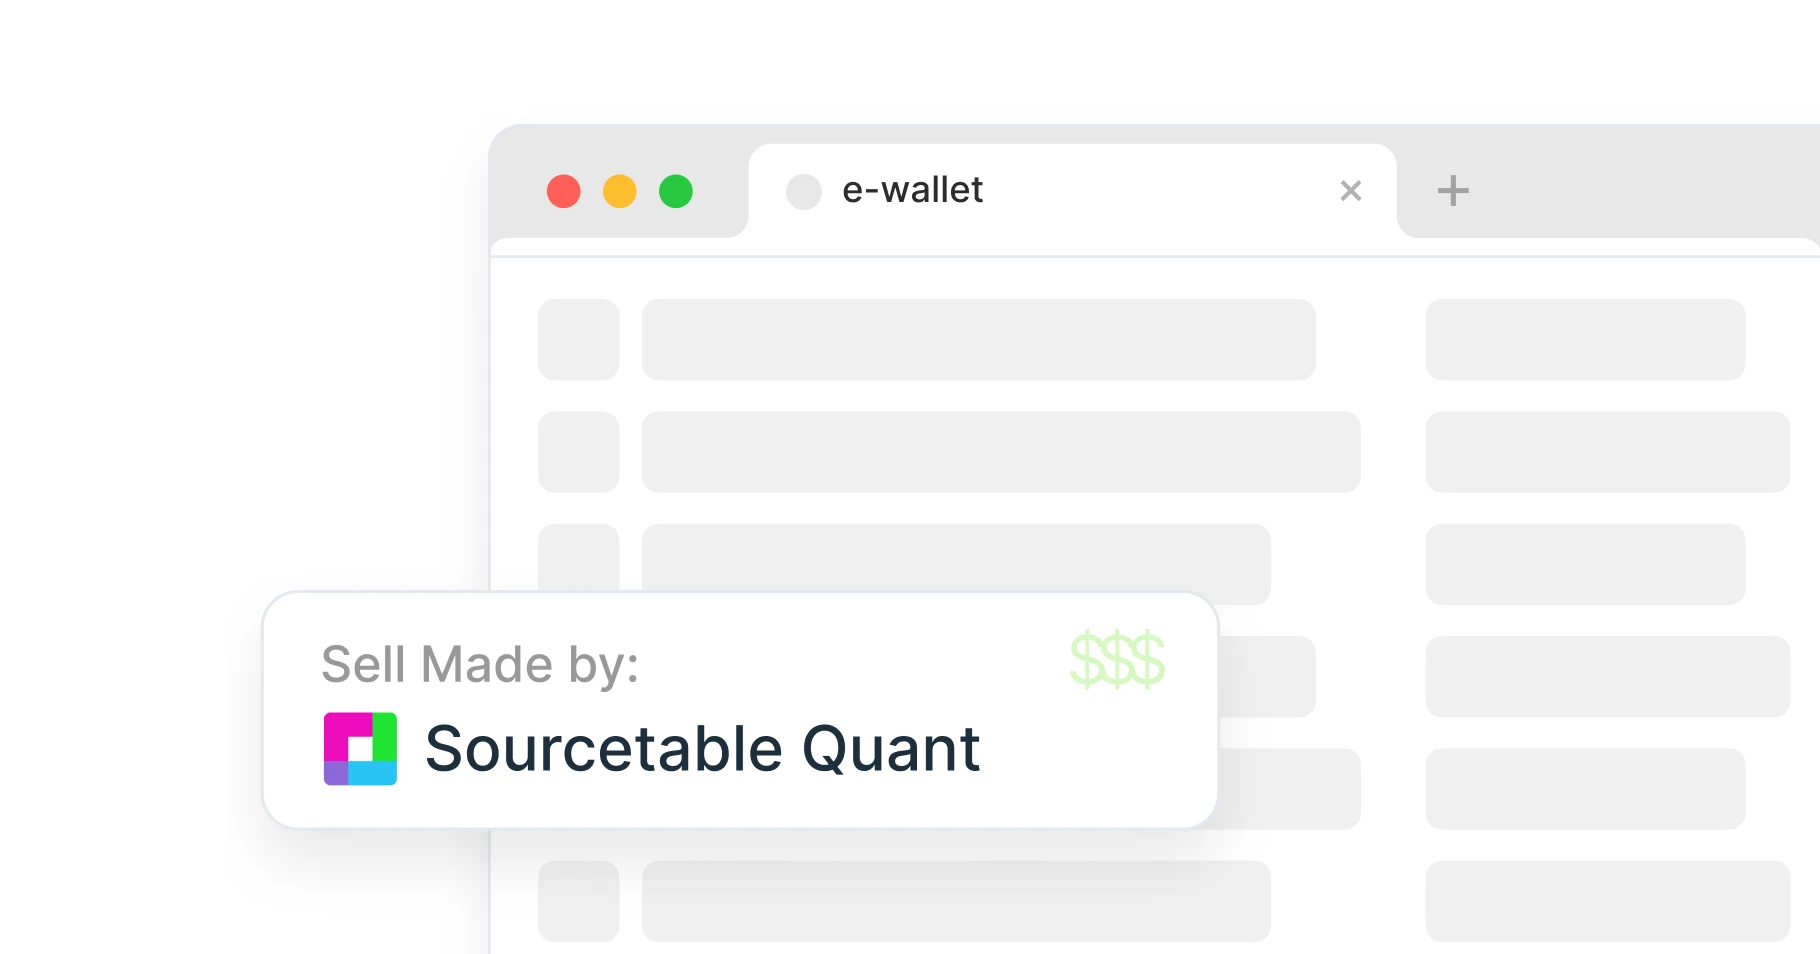
Execute Trades
Place trades through connected brokerages and platforms, alongside research and modeling.
Ready to Transform Your MSCI Hong Kong Index Analysis?
Join thousands of finance professionals who've made the switch to AI-powered index analysis
Frequently Asked Questions
If your question is not covered here, you can contact our team.
Contact UsWhat tools does Sourcetable offer for index analysis?
What data sources does Sourcetable support?
How do I import MSCI Hong Kong data into Sourcetable?
What analysis can I do with MSCI Hong Kong data?
How much does Sourcetable cost?
Can I create charts and visualizations?
How do I analyze MSCI Hong Kong with AI?
SourceTable
Join thousands of finance professionals who've made the switch to Al-powered stock analysis