Analyze FTSE RAFI Canada data with AI
Sourcetable's AI is the smartest way to analyze market data. Built for Financial Analysts, Traders & Portfolio Managers, it's your AI-native Bloomberg-alternative.

Our Impact
100+
Canadian RAFI Stocks
90%
Time Savings vs Excel
5 Min
Complete Analysis Time
Why Choose Sourcetable for FTSE RAFI Canada Analysis?
Combine the power of Excel with advanced AI to analyze Canadian stocks like never before
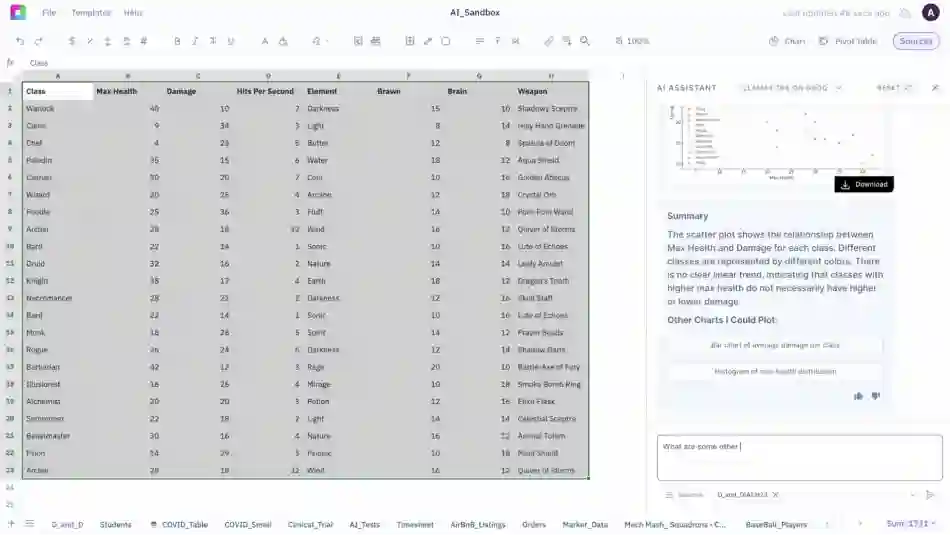
AI-Powered Analysis
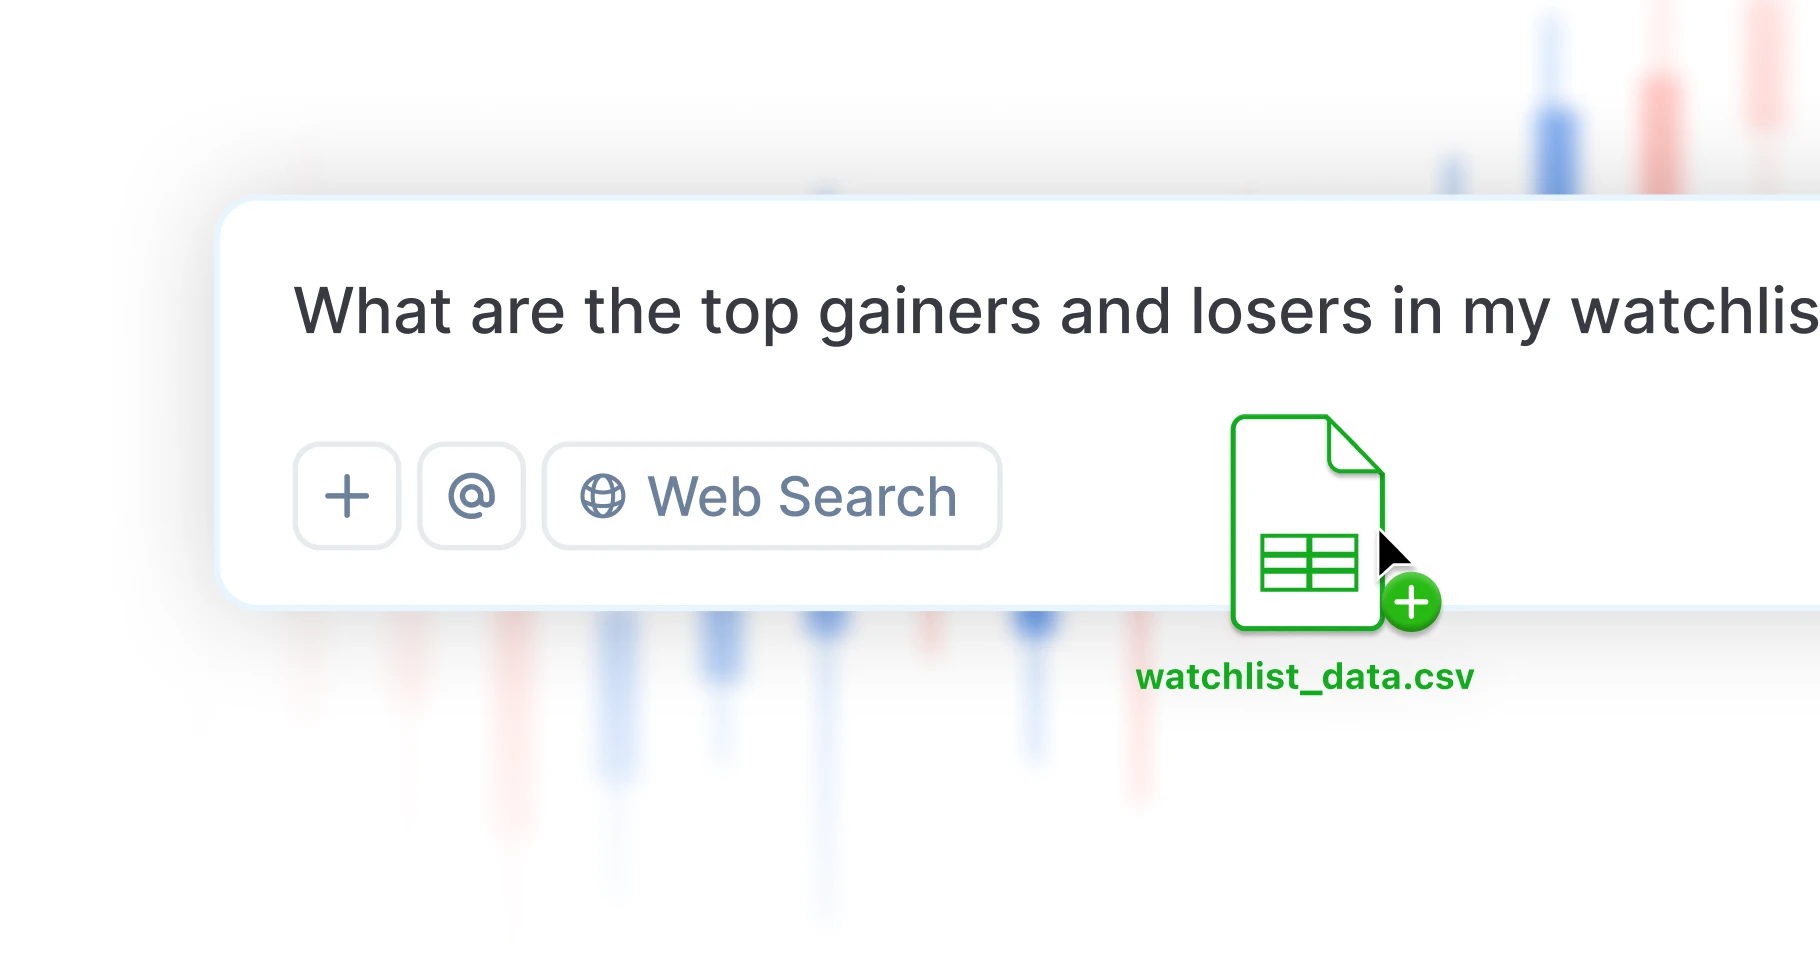
Ask questions in plain English: "Which FTSE RAFI Canada stocks show the strongest performance in fundamental weighting?" Get instant answers with automated calculations and visual insights.
FTSE RAFI Canada Data Analysis
Import and analyze FTSE RAFI Canada data. Track index performance, sector allocations, and fundamental weighting with comprehensive historical data covering Canadian stocks.
Instant Insights
Generate sector comparisons, risk assessments, and performance rankings in seconds. No more manual data entry or complex formula building.
Advanced Visualizations
Create professional charts, heat maps, and dashboards automatically. Export presentation-ready reports for clients or stakeholders.
Smart Screening
Filter FTSE RAFI Canada constituents by any criteria: market cap, sector allocation, fundamental weighting, and performance metrics across regional markets.
Risk Analysis
Calculate portfolio risk, correlation matrices, and volatility measures across FTSE RAFI Canada holdings with enterprise-grade accuracy.

Market Analysis Tools
Plan, research, and analyze markets inside Sourcetable with macro trading models, portfolio balancing, and advanced stock analysis. making complex strategies easier to design, test, and compare.
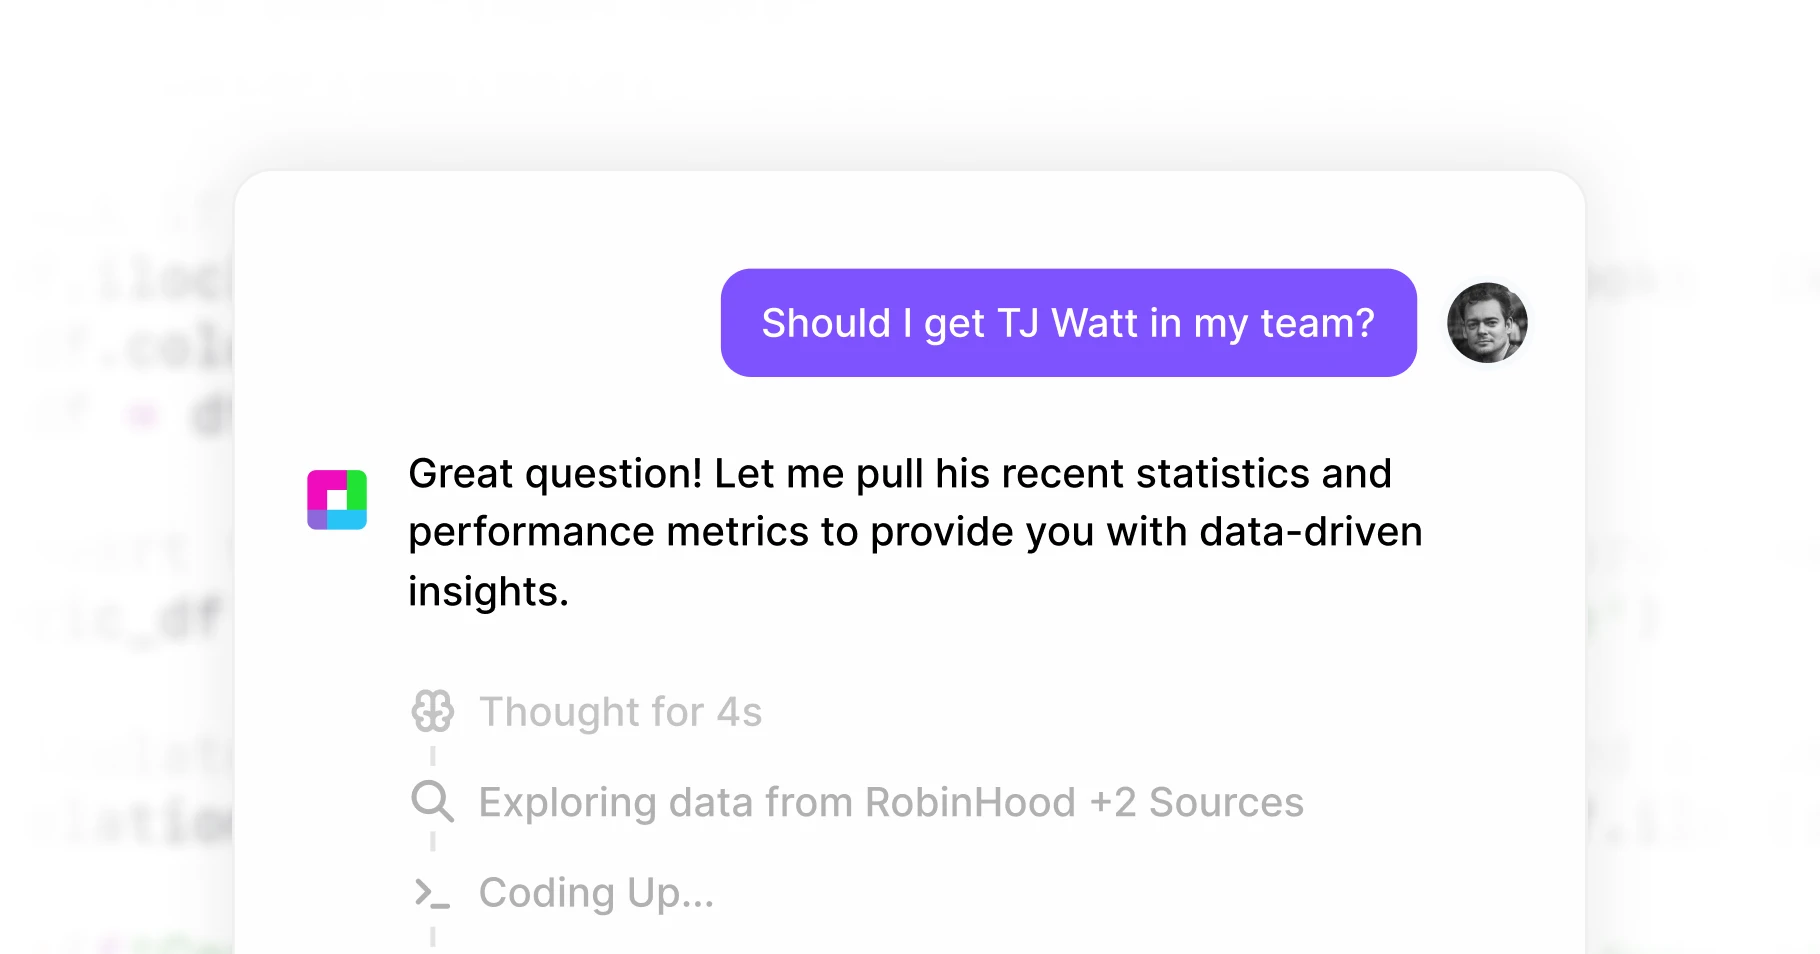
Code with AI
Run advanced financial analysis and research with natural language and Python-powered models.
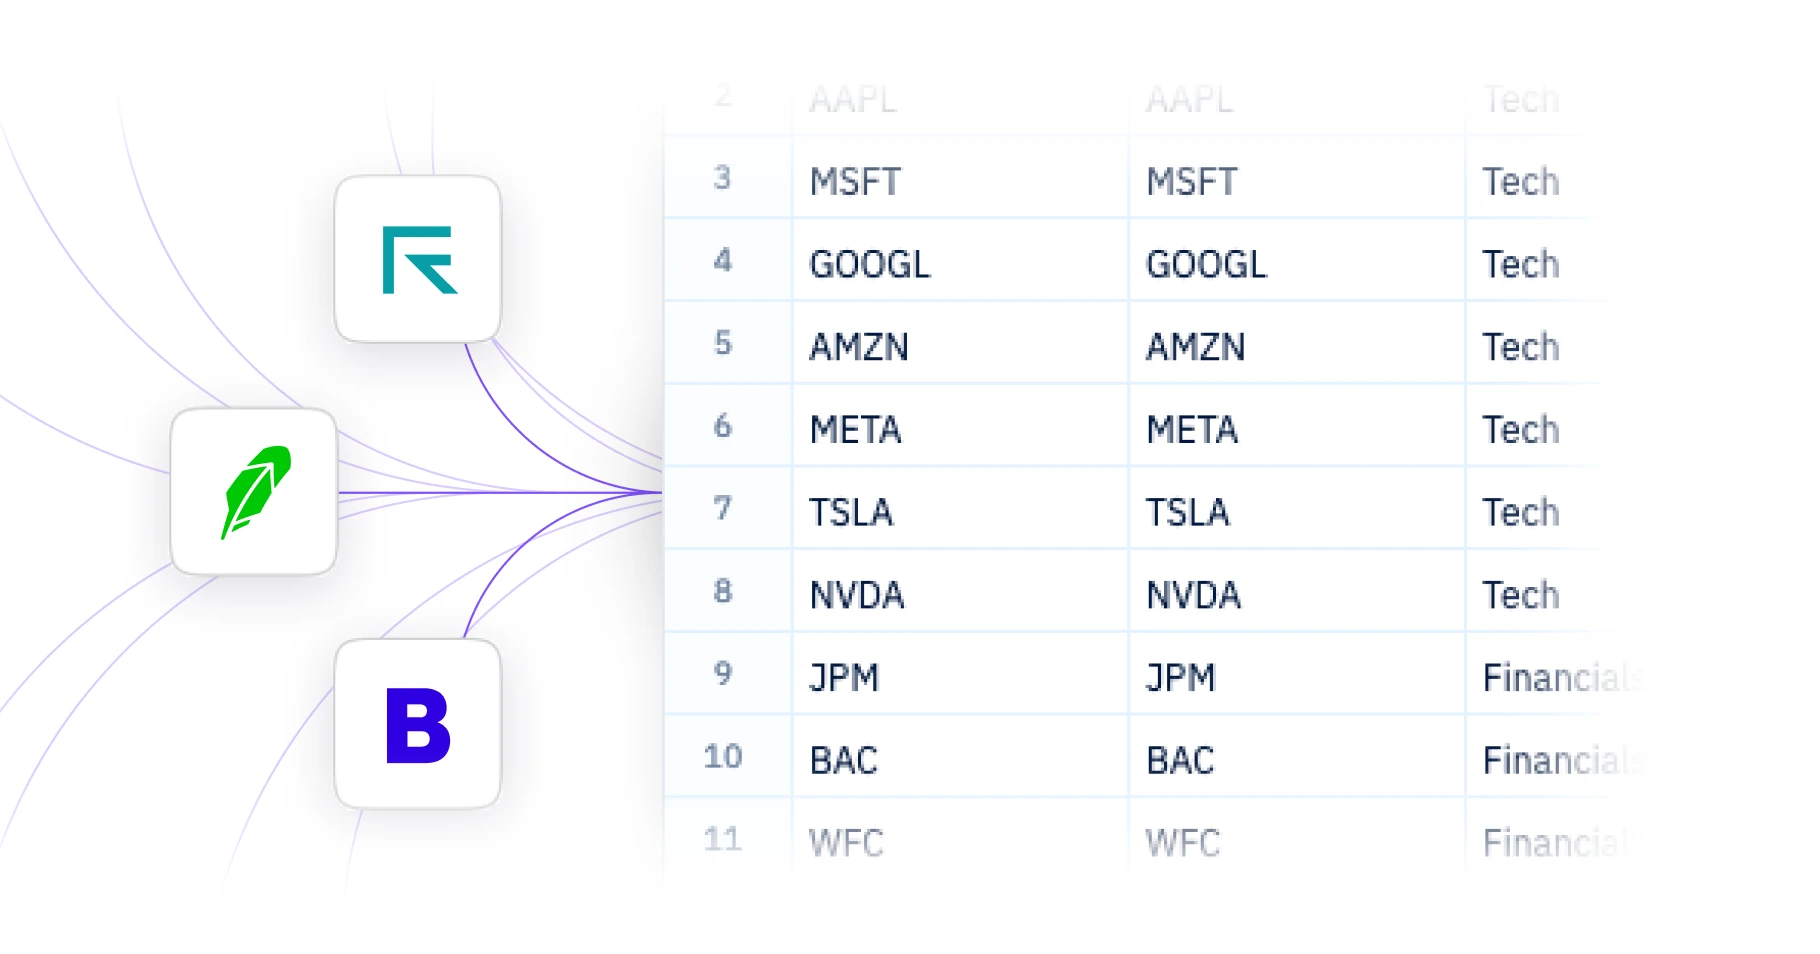
Stay Connected
Connect brokerages, exchanges, data providers, and databases into one workflow via Superagents.
Execute Trades
Place trades through connected brokerages and platforms, alongside research and modeling.
SourceTable
Join thousands of finance professionals who've made the switch to Al-powered stock analysis