Pingdom logo
Sourcetable logo

Connect Pingdom to Sourcetable, and analyze monitoring data with AI

You've never seen a spreadsheet do this before.

No credit card required
FREE PRO PLAN FOR 14 DAYS.
A B C D E
1
Service
Uptime
Checked
Latency
Status
2
API Gateway
99.98%
2025-12-14
45ms
Healthy
3
Database
99.95%
2025-12-14
12ms
Healthy
4
Cache Layer
99.99%
2025-12-13
8ms
Healthy
5
Auth Service
99.92%
2025-12-13
Testing...
Warning
6
CDN
100.00%
2025-12-12
15ms
Healthy
Monitoring data from Pingdom
Made with: Sourcetable Sourcetable

Use Pingdom, show me system health metrics

See how simple it is to connect...

...and analyze Pingdom data.

I used to check Pingdom dashboards manually and compile status reports. Now I analyze system health with natural language queries.

— Operations Manager
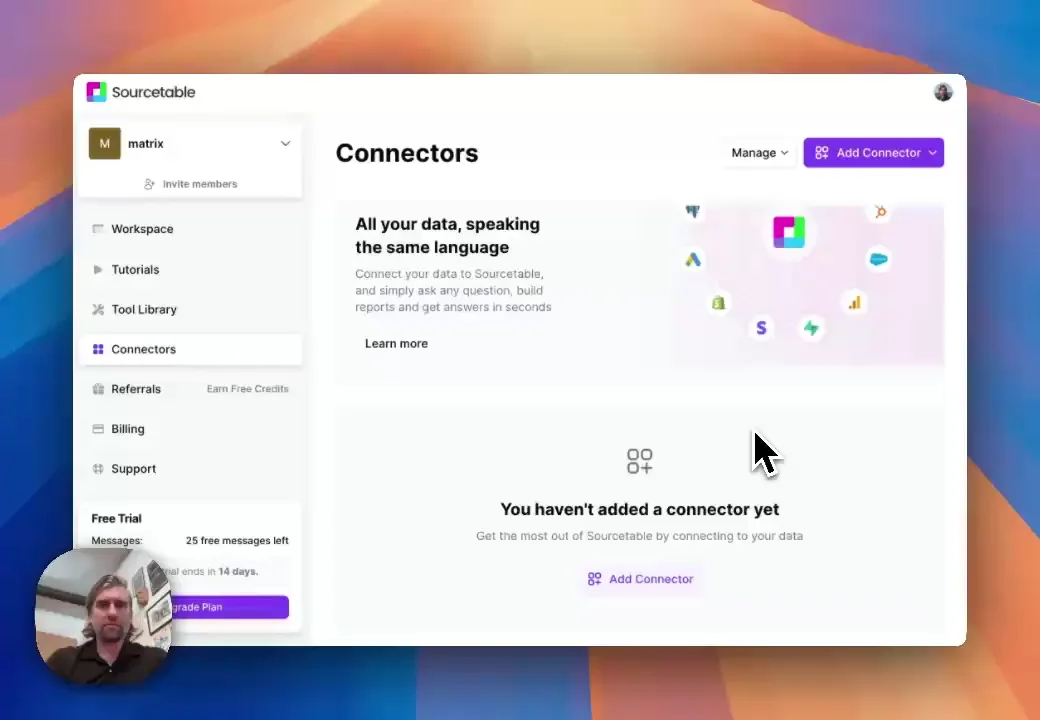
Enterprise-grade Security

Your data is protected by industry-leading SOC 2 Type 2, HIPAA, and PCI compliance standards, whether in our cloud or on-premises.

Private User Keys

Private User Keys

Encrypted at REST

Encrypted at REST

Escrow KMS

Escrow KMS

Connectors

Connectors

Connect to any:

Database ⋆ API ⋆ MCP

Connectors

Recommended Connectors

Connect your most-used data sources and tools to Sourcetable for seamless analysis.

Frequently Asked Questions

If you question is not covered here, you can contact our team.

Contact Us
How do I connect Pingdom to Sourcetable?
Connect your Pingdom account to Sourcetable by clicking "Start connecting" and authenticating with your Pingdom credentials. Once connected, you can analyze monitoring data, create visualizations, and build reports directly from your spreadsheet using natural language commands.
What can I do with the Pingdom connector?
The Pingdom connector lets you analyze monitoring data, create custom reports, track key metrics, and build automated dashboards. You can analyze your Pingdom data using plain English and Sourcetable will fetch and analyze the data automatically.
Can I analyze my Pingdom data with AI?
Yes! You can analyze your Pingdom data using plain English queries. Ask questions like "Show me system health metrics" and Sourcetable's AI will analyze your Pingdom account and create visualizations automatically.
Is my Pingdom data secure?
Yes. Sourcetable uses industry-standard OAuth 2.0 authentication and encryption to connect to your Pingdom account. Your credentials and data are encrypted both in transit and at rest. We follow enterprise security best practices and you maintain full control over your Pingdom account permissions.
How often does my Pingdom data sync with Sourcetable?
Your Pingdom data syncs automatically when you run a query or fetch data. You can manually refresh at any time to get the latest information. This ad-hoc approach means you always work with current data while maintaining control over when data is fetched.
How is this different from exporting Pingdom data to Excel or CSV?
Unlike static CSV exports, Sourcetable connects directly to your live Pingdom data. You can query current data using natural language without writing SQL, create dynamic dashboards that update on-demand, and analyze trends across any time period instantly. No more downloading files, copying data between spreadsheets, or manually updating reports.
Can I import historical Pingdom data from before I connected?
Yes! When you connect Pingdom to Sourcetable, you can access all historical data available in your Pingdom account. Specify date ranges in your queries like "Show me all data from the past 2 years" and Sourcetable will fetch the historical records from Pingdom's API.
How does Sourcetable replace my manual Pingdom reporting workflows?
Instead of waiting for scheduled reports or manually exporting CSVs, you can run any analysis instantly whenever you need it. Ask questions on-demand and get answers in seconds. Save your most common queries as templates, share them with your team, and build dashboards that anyone can refresh with a click. This ad-hoc approach means you're never waiting for reports - you create insights when you need them.
What data sources does Sourcetable support?
We currently support a variety of data file formats including spreadsheets (.xls, .xlsx, .csv), tabular data (.tsv), JSON, and database data (MySQL, PostgreSQL, MongoDB). We also support application data like Pingdom and most plain text data. View all available connectors at sourcetable.com/connectors.
Can I generate data visualizations?
Yes! It's very easy to generate clean-looking data visualizations using Sourcetable. Simply prompt the AI to create a chart or graph. For Pingdom data, you can create charts showing trends, distributions, comparisons, and more. All visualizations are downloadable and can be exported as interactive embeds.
What data science tools are available?
Sourcetable's AI analyzes and cleans data without you having to write code. Use Python, SQL, NumPy, Pandas, SciPy, Scikit-learn, StatsModels, Matplotlib, Plotly, and Seaborn to analyze your Pingdom data and create insights.
Is this free?
Yes! Sourcetable's spreadsheet is free to use, just like Google Sheets. AI features have usage limits. Users can upgrade to the Pro plan for more credits.
Is there a discount for students, professors, or teachers?
Students and faculty receive a 50% discount on the Pro and Max plans. Email support@sourcetable.com to get your discount.
Is Sourcetable programmable?
Yes. Regular spreadsheet users have full A1 formula-style referencing at their disposal. Advanced users can make use of Sourcetable's SQL editor and GUI, or ask our AI to write Python code for you.
Sourcetable Logo
Sourcetable + Pingdom

Turn your data into actionable insights.

Drop CSV