Get spreadsheet work
done in seconds
Analyze files, create visualizations, write formulas,
research and clean data with AI
Trusted by students and professors at


Work smarter
A1 notation
AI Formula Assist ✨
Let's start with the basics. Yes, Sourcetable will write your spreadsheet formulas for you.
SUM, SUMIF, XLOOKUP, VLOOKUP, INDEX, XNPV, XIRR, CHOOSE... we do it all.
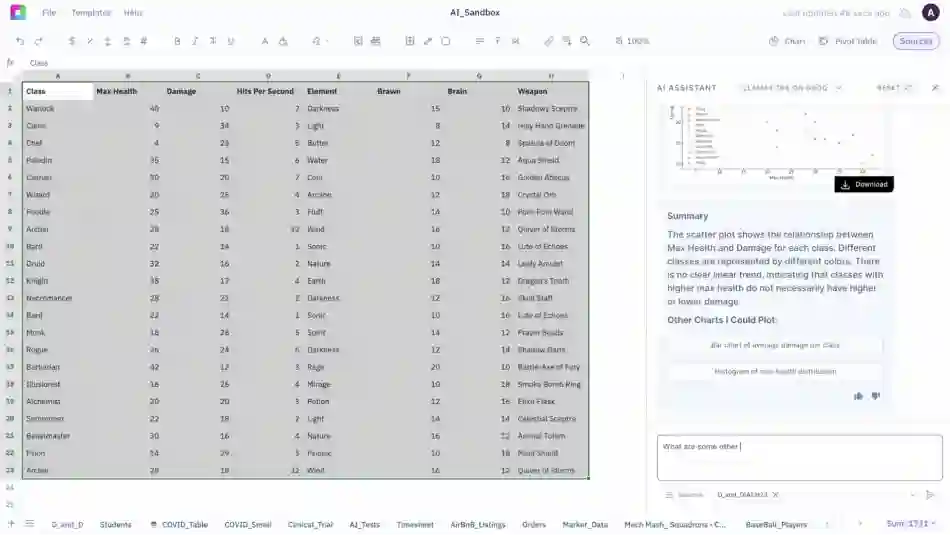
Interactive reports
AI Charts & Graphs 🏄
Step 1: Select your data.
Step 2: Describe the chart you want.
Step 3: You're done!
Now you can go surfing.
Enrich like a boss
AI Research 🔍
If it's on the Internet, it's probably in our dataset. Sourcetable's research assistant will autofill your spreadsheet with anything you can reasonably ask for. Don't forget to ask nicely!
Learn moreScrub, scrub, click!
AI Data Cleaning 🧹
Save your virtual assistant hours of tedious, boring, manual work with the click of a button. Sourcetable gives them the leverage they need to spend time on more important tasks.
Learn moreA1, SQL & Python
AI Analysis 🔬
Analysis should be driven by curiosity. Pair with AI to analyze data, ask questions, and get smarter about your work.
Advanced users can leverage Sourcetable for code-driven analysis and insights.
TL;DR
AI Summaries 📝
Imagine you are a busy executive. You've just been handed the internal HR survey with 1,000s of entries to read before tomorrow's big meeting.
All nighter? Or try Sourcetable.
Voice-driven spreadsheets
Talk to your data 🎙️
It's the experience we're building at Sourcetable.
Sit back, relax, and go hands-free.
Integrations
Only one spreadsheet 💍
Connect live data from over 100+ integrations and databases, without code.
Browse all integrations


Try out Sourcetable right now
Upload your CSV file and start analyzing your data. No signup required.

Drag and drop or choose a CSV
to start analyzing your
data!
Work smarter
Al is here to help. Leverage the latest models to
analyze spreadsheets, enrich data, and create reports.