Sourcetable — The AI Spreadsheet
Sourcetable is a new kind of spreadsheet built to make you incredibly productive, with AI. Chat with your data, analyze, clean, filter, research, build financial models, create charts & graphs, and more.
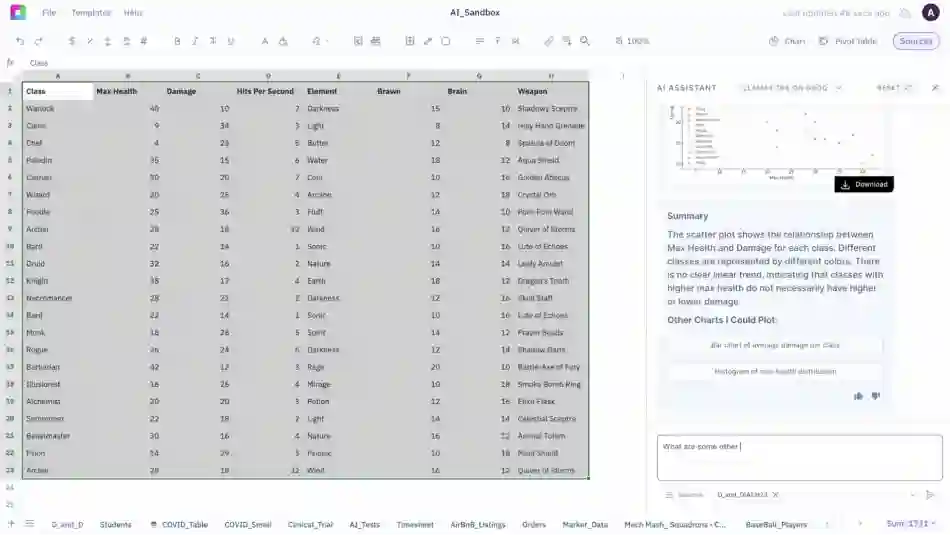
The AI Spreadsheet
Built to make you extraordinarily productive, Sourcetable is the best way to vibe with AI

Trusted by students and professors at


Work smarter
A1, SQL & Python
AI Analysis 🔬
Analysis should be driven by curiosity. Pair with AI to analyze data, ask questions, and get smarter about your work.
Advanced users can leverage Sourcetable for code-driven analysis and insights.
Enrich like a boss
AI Research 🔍
If it's on the Internet, it's probably in our dataset. Sourcetable's research assistant will autofill your spreadsheet with anything you can reasonably ask for. Don't forget to ask nicely!
Learn moreScrub, scrub, click!
AI Data Cleaning 🧹
Save your virtual assistant hours of tedious, boring, manual work with the click of a button. Sourcetable gives them the leverage they need to spend time on more important tasks.
Learn moreA1 notation
AI Formula Assist ✨
Let's start with the basics. Yes, Sourcetable will write your spreadsheet formulas for you.
SUM, SUMIF, XLOOKUP, VLOOKUP, INDEX, XNPV, XIRR, CHOOSE... we do it all.
Interactive reports
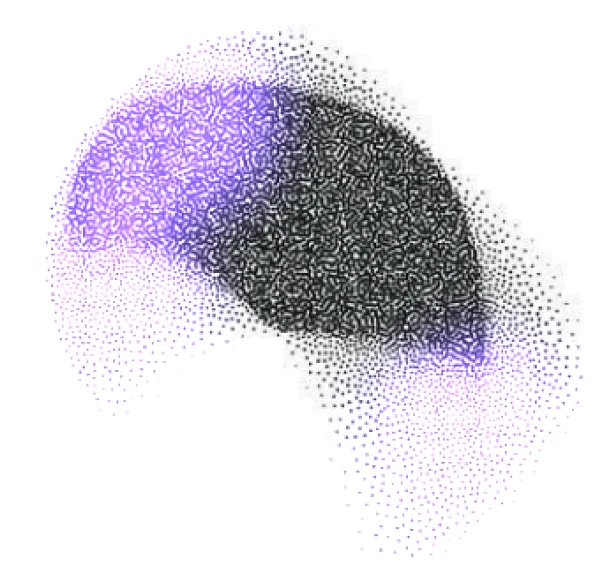
AI Charts & Graphs 🏄
Sourcetable comes with a beautiful graphs for your reporting pleasure. Create regular visualizations, or use AI with Plotly, Matplotlib, and Bokeh.
Learn moreTL;DR
AI Summaries 📝
Imagine you are a busy executive. You've just been handed the internal HR survey with 1,000s of entries to read before tomorrow's big meeting.
All nighter? Or try Sourcetable.
Voice-driven spreadsheets
Talk to your data 🎙️
It's the experience we're building at Sourcetable.
Sit back, relax, and go hands-free.
Integrations
Only one spreadsheet 💍
Connect live data from over 100+ integrations and databases, without code.
Browse all integrations


Your job, just way easier
Sourcetable is a tool that helps you get the most out of your data. It's like having a personal assistant that can help you with your data needs.
-
Finance
Build financial models and analyze market data. Get instant insights for investment decisions and financial reporting.

-
Data Science
Clean datasets and run statistical analysis. Perfect for data scientists working with complex data structures.

-
Business
Transform business metrics into actionable insights. Make data-driven decisions faster and with confidence.

-
Scientific Research
Process experimental data and analyze research results. Generate visualizations and uncover patterns in your findings.

-
Marketing
Analyze campaign performance and customer behavior. Optimize your marketing strategy using data-driven recommendations.
-
Education
Grade assignments and analyze student performance. Create teaching materials and track academic progress effortlessly.

Featured on
Checkout what Sourcetable has to offer


Frequently Asked Questions
How do analyze data?
To analyze spreadsheet data, just upload a file and start asking questions. Sourcetable's AI can answer questions and do work for you. You can also take manual control, leveraging all the formulas and features you expect from Excel or Google Sheets.
What data sources are supported?
We currently support a variety of data file formats including spreadsheets (.xls, .xlsx, .csv), tabular data (.tsv), JSON, and database data (MySQL, PostgreSQL, MongoDB). We also support application data, and most plain text data.
What data science tools are available?
Sourcetable's AI analyzes and cleans data without you having to write code. Use Python, SQL, NumPy, Pandas, SciPy, Scikit-learn, StatsModels, Matplotlib, Plotly, and Seaborn.
Can I analyze spreadsheets with multiple tabs?
Yes! Sourcetable's AI makes intelligent decisions on what spreadsheet data is being referred to in the chat. This is helpful for tasks like cross-tab VLOOKUPs. If you prefer more control, you can also refer to specific tabs by name.
Can I generate data visualizations?
Yes! It's very easy to generate clean-looking data visualizations using Sourcetable. Simply prompt the AI to create a chart or graph. All visualizations are downloadable and can be exported as interactive embeds.
What is the maximum file size?
Sourcetable supports files up to 10GB in size. Larger file limits are available upon request. For best AI performance on large datasets, make use of pivots and summaries.
Is this free?
Yes! Sourcetable's spreadsheet is free to use, just like Google Sheets. AI features have a daily usage limit. Users can upgrade to the pro plan for more credits.
Is there a discount for students, professors, or teachers?
Currently, Sourcetable is free for students and faculty, courtesy of free credits from OpenAI and Anthropic. Once those are exhausted, we will skip to a 50% discount plan.
Is Sourcetable programmable?
Yes. Regular spreadsheet users have full A1 formula-style referencing at their disposal. Advanced users can make use of Sourcetable's SQL editor and GUI, or ask our AI to write code for you.
Work smarter
Al is here to help. Leverage the latest models to
analyze spreadsheets, enrich data, and create reports.