Google Looker
tool icon

Google Looker vs Yellowfin BI: A Comparative Analysis

Jump to

    Introduction

    Choosing the right business intelligence (BI) tool is crucial for data-driven decision making. Google Looker and Yellowfin BI are popular options that offer different features and user experiences.

    This comparison will delve into the specifics of each platform, including visualization capabilities, customizability, and ease of use.

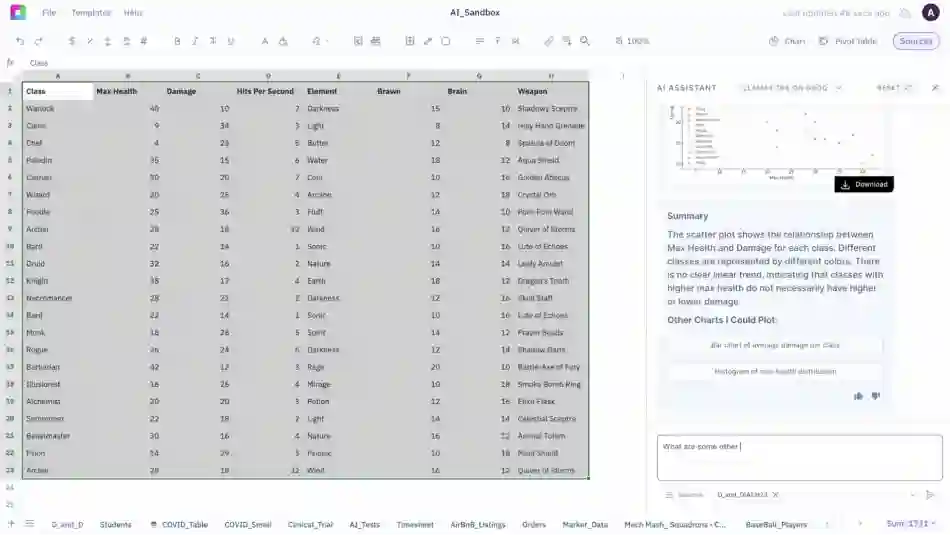
    Additionally, we'll explore Sourcetable, which offers a modernized, spreadsheet-like interface that syncs with your data, presenting an alternative for business intelligence tasks like reporting and data analytics.

    Google Looker

    What is Google Looker?

    Google Looker is a business intelligence platform that is part of the Google Cloud suite of products. It enables users to access, analyze, and act on their data. As a self-service and governed BI platform, Google Looker offers robust data experiences through various functionalities.

    • Key Features

    • Delivers data experiences by allowing users to create and share reports and dashboards.
    • Enables chatting with business data for interactive data exploration.
    • Supports the use of generative AI to build data-driven applications.
    • Facilitates the development of custom applications with reliable metrics.
    • Integrates with existing BI environments through Looker modeling.
    • Accessibility

      Available in the cloud, Google Looker provides a flexible and scalable solution for data analysis needs across various industries.

    tool icon

    What is Yellowfin BI?

    Yellowfin BI is a business intelligence platform that has been evolving over the past 20 years. It focuses on enhancing data accessibility, actionability, and aesthetics for users and organizations. As a comprehensive analytics solution, Yellowfin BI streamlines the process of connecting to, preparing, and visualizing data.

    • Key Features

    • Simplifies the analytics workflow
    • Facilitates data preparation and connectivity
    • Enables creation of dashboards and management reports
    • Offers a no-code/low-code development environment
    • Supports deployment on both public and private clouds
    • Allows integration with various applications
    • Accessibility

      Yellowfin BI is designed for ease of use, enabling access to analytics for a wide user base without the need for extensive coding skills.

    • Adoption

      The platform is utilized by over 29,000 companies globally, underscoring its wide acceptance and applicability across various industries.

    Google Looker

    Key Features of Google Looker

    Business Intelligence Capabilities

    Looker is a BI tool that delivers enterprise-class business intelligence. It provides users with a reliable, real-time view of their data, ensuring freshness, consistency, and governance.

    Data Integration and Management

    Looker accesses data across multiple clouds, allowing for a centralized system of record. It uses LookML, a SQL-based modeling language, for defining and managing business rules and data definitions. This model is version-controlled with Git.

    Looker Studio Integration

    Users can connect to Looker's semantic model to analyze, explore, and visualize data directly within Looker Studio, a platform for creating customizable reports and dashboards.

    Google Cloud Infrastructure

    As a core product of the Google Cloud suite, Looker is built on Google Cloud infrastructure, seamlessly integrated within the Google Cloud console, and is available as a service on Google Cloud.

    APIs and Integrations

    Looker offers robust APIs and prebuilt integrations, which facilitate proactive insights and extend functionality within the enterprise ecosystem.

    tool icon

    Yellowfin BI Key Features

    Analytics and Reporting

    Enterprise and embedded analytics capabilities Bespoke analytical application development Drag and drop report builder for tabular reports and complex queries Support for JDBC and XML/A compliant databases and CSV files Integration with Exasol for high-speed database performance Metadata-driven optimized query generation Access to data via stored procedures and plugins Scheduled report distribution with customizable rules

  • Enterprise and embedded analytics capabilities
  • Bespoke analytical application development
  • Drag and drop report builder for tabular reports and complex queries
  • Support for JDBC and XML/A compliant databases and CSV files
  • Integration with Exasol for high-speed database performance
  • Metadata-driven optimized query generation
  • Access to data via stored procedures and plugins
  • Scheduled report distribution with customizable rules
  • Data Integration and ETL

    Complete Extract, Transform, Load (ETL) module Custom transformation step creation Metadata modeling with a user-friendly drag and drop interface

  • Complete Extract, Transform, Load (ETL) module
  • Custom transformation step creation
  • Metadata modeling with a user-friendly drag and drop interface
  • Data Visualization and Dashboards

    Variety of visualization methods available Multi-source data integration in dashboards Dashboard customization with text, images, and icons Third-party application linkage to dashboards

  • Variety of visualization methods available
  • Multi-source data integration in dashboards
  • Dashboard customization with text, images, and icons
  • Third-party application linkage to dashboards
  • Data Science and Machine Learning

    Data science model integration Machine learning for insight discovery Automatic data analysis with Assisted Insights and Discovery Notification of significant changes via Signals

  • Data science model integration
  • Machine learning for insight discovery
  • Automatic data analysis with Assisted Insights and Discovery
  • Notification of significant changes via Signals
  • Collaboration and Distribution

    Signal tracking and discussion in Data Stories Options for users to follow, share, and comment on insights

  • Signal tracking and discussion in Data Stories
  • Options for users to follow, share, and comment on insights
  • Mobile Application

    Mobile app functionality with biometric integration Real-time alerts on Signals, Stories, and mentions Social features for liking, sharing, and posting Quick insight sharing across organizations

  • Mobile app functionality with biometric integration
  • Real-time alerts on Signals, Stories, and mentions
  • Social features for liking, sharing, and posting
  • Quick insight sharing across organizations
  • Google Looker

    Benefits of Google Looker Studio Pro for Business Intelligence

    Enhanced Data Exploration and Visualization

    Looker Studio Pro enables comprehensive data exploration and visualization, aiding users in answering critical business questions. Its visualization capabilities facilitate the creation of insightful dashboards.

    Enterprise-Grade Features

    With enterprise features, Looker Studio Pro supports complex, large-scale business environments, ensuring that teams can manage content effectively and leverage enterprise-level support.

    Collaboration and Sharing

    Designed for medium to large enterprises, Looker Studio Pro excels in team collaboration and dashboard sharing, streamlining business intelligence processes.

    Google Looker

    Disadvantages of Using Google Looker

    Integration and Connectivity Issues

    Users experience a lack of connectivity with certain data sources when using Google Looker, which can hinder the process of integrating business intelligence into existing systems.

    Complex Sharing and Onboarding

    The mechanism for sharing reports and dashboards in Looker is complex, posing challenges for collaboration. Additionally, onboarding new users is an expensive process, potentially increasing the overall cost of operation.

    User Experience Challenges

    Google Looker's interface is not very intuitive, leading to a steep learning curve for new users. Moreover, the performance issues such as lag and slow loading times, especially with multiple graphs on a single page, can frustrate users and reduce efficiency.

    Documentation and Support

  • Training materials and documentation for Looker are not readily accessible, making it difficult for users to learn and troubleshoot on their own.
  • Migrating data, such as from AWS to BigQuery, is often described as a painful process, adding to the complexities of using Looker.
  • Security and Accessibility

    The security protocols in place can restrict access more than necessary, making it challenging for users to perform their tasks effectively within Google Looker.

    Google Looker

    Frequently Asked Questions About Google Looker

    What are the hours for Looker Support in Japanese language?

    Support is available from 9:00 AM JST – 5:00 PM JST, Monday – Friday, and from 5:00 PM JST – 9:00 AM JST, Monday – Saturday, including weekends and holidays for Japanese language.

    Can I receive Looker Support for any version of Looker?

    Looker Support is available only on Looker instances running an officially supported Looker version.

    What should I do if my customer-hosted Looker instance is running an unsupported version?

    Customer-hosted instances running an unsupported Looker version must update to a supported Looker version to receive Looker Support.

    Who is eligible to receive Looker Support?

    Looker Support is available to users with the Tech Support Editor IAM role and to administrators and developers on instances using Legacy Support.

    Is there anything I need to do to enable Looker Support for Looker (original) instances?

    For Looker (original) instances, you need to have the Google Cloud Project number filled in on the Admin General Settings page to receive Looker Support.

    Use Cases for Google Looker

    • Google Looker

      Reducing client report time

    • Google Looker

      Modernizing business intelligence systems

    • Google Looker

      Embedding analytics in quote-to-revenue platforms

    tool icon

    Advantages of Yellowfin BI for Business Intelligence

    Accessibility for All User Levels

    Yellowfin BI supports diverse user groups, enabling both non-technical and technical users to leverage its analytics capabilities efficiently. This broad accessibility fosters a data-driven culture within organizations.

    Self-Service Analytics

    As a self-service tool, Yellowfin BI permits users to independently perform data analysis, which accelerates the decision-making process and reduces dependency on specialized staff.

    Data Democratization

    Democratizing data, Yellowfin BI ensures that valuable insights are not siloed but are accessible across the organization, which enhances collaboration and strategic alignment.

    Operational Agility and Efficiency

    Enhancing agility, Yellowfin BI streamlines reporting and analytics, thus improving the efficiency of business operations and enabling quicker response to market changes.

    Consistency in Data

    Providing a single source of truth, Yellowfin BI eliminates discrepancies in data, ensuring that all stakeholders make decisions based on consistent and accurate information.

    Reduced IT Strain

    By minimizing the need for IT intervention in report generation and analysis, Yellowfin BI reduces the burden on IT departments, allowing them to focus on more strategic initiatives.

    Guided Data Exploration

    Yellowfin BI's guided analytics helps users navigate through complex data sets, simplifying the process of uncovering insights and enhancing overall user experience.

    tool icon

    Disadvantages of Yellowfin BI

    Limited Access Control

    Yellowfin BI lacks essential security features such as Table-Level and Field-Level Access Control within its BI-layer. This can pose significant challenges in managing data permissions and ensuring secure access to sensitive information.

    Performance Issues

  • Users report slow data extraction processes, which can hinder timely business intelligence insights.
  • Integration with Google Analytics is deemed cumbersome by some users, potentially complicating the analytics workflow.
  • Report preparation is sometimes plagued by lag and hanging, leading to inefficiencies and frustration.
  • Charting and Visualization Limitations

    There is a demand for more dynamic charting options among users, suggesting that Yellowfin BI's current visualization capabilities are not meeting all business needs.

    Business Model Compatibility

    The business model of Yellowfin may present alignment challenges with other business processes, potentially affecting seamless integration and collaboration.

    Competition

    Alternatives such as Tableau Server, QlikView, and Tableau Desktop are common choices that could offer features and capabilities that Yellowfin does not, influencing the decision-making process.

    tool icon

    Frequently Asked Questions About Yellowfin BI

    What resources are available through the Yellowfin Support Center?

    The Yellowfin Support Center includes documentation, videos, and community resources.

    Can I learn how to use Yellowfin through the company's own training program?

    Yes, the Yellowfin University offers courses on using Yellowfin.

    Is there a way for users to contribute to Yellowfin's product development?

    Yellowfin offers a community where users can vote on product ideas.

    What is the purpose of Yellowfin's Quick Start Program for ISVs?

    The Quick Start Program is designed to help ISVs take software applications to market with embedded BI.

    Does Yellowfin offer any regular updates or insights through a newsletter?

    Yes, Yellowfin has a newsletter called the Y-Files.

    Use Cases for Yellowfin BI

    • tool icon

      Embedded analytics for telecommunications companies

    • tool icon

      Data storytelling in retail

    • tool icon

      Dashboard creation for finance sector

    • tool icon

      Data visualization for healthcare industry

    • tool icon

      Automated business monitoring in automotive

    sourcetable

    Why Sourcetable is a Superior Choice for Business Intelligence

    Sourcetable offers a streamlined approach to business intelligence compared to Google Looker and Yellowfin BI. By integrating data from various services into a user-friendly, spreadsheet-like interface, Sourcetable simplifies the complexities of data analytics and reporting. This efficiency resonates with businesses seeking a more accessible BI solution.

    • Simplified Reporting and Analytics

      Sourcetable's unified platform enables seamless synchronization of data, which outperforms Google Looker's self-service BI and Yellowfin's governed data solutions in terms of ease of use. Its spreadsheet-centric approach appeals to organizations preferring familiar interfaces over complex BI tools.

    • Enhanced Data Accessibility

      Unlike Google Looker, which requires building data-powered applications for data access, Sourcetable's straightforward interface allows for immediate data analysis without the need for additional application development, making it a preferred alternative for rapid data access and action.

    • Trusted Data Experiences

      While Google Looker delivers trusted data experiences, Sourcetable's advantage lies in its inherent simplicity, removing barriers to data trust and comprehension. This positions Sourcetable as a more approachable option for businesses of all sizes.

    • Flexibility in Data Modeling and BI

      Sourcetable excels in offering flexibility akin to Google Looker's embedded data modeling and analytics applications but does so through a more intuitive interface, reducing the learning curve and enhancing the overall user experience.

    • Accessible Business Intelligence

      Organizational and self-service business intelligence, as provided by Looker, are integral to modern BI. Sourcetable matches these needs with less complexity, making it an attractive alternative for companies prioritizing ease of use and rapid deployment.

    • Streamlined Workflows and Applications

      Building workflows and applications is a feature of Looker; however, Sourcetable simplifies this process by offering a cohesive environment that integrates with existing workflows, minimizing the need for specialized technical knowledge.

    • Direct Data Interaction

      The ability to chat with business data, as seen in Looker, is innovative, yet Sourcetable's direct manipulation of data within its spreadsheet interface allows for immediate insights, providing a clear-cut method for interacting with data.

    Google Looker
    vs
    tool icon

    Comparison Between Google Looker and Yellowfin BI

    Business Intelligence Capabilities

    Both Google Looker and Yellowfin BI serve as business intelligence platforms, providing organizations with tools for data analysis and reporting.

    Self-Service and Governed BI

    Google Looker and Yellowfin BI offer self-service business intelligence, enabling users to access and analyze data without IT assistance. They also provide governed BI, ensuring data governance and security.

    Data-Powered Applications

    Both platforms allow the creation of data-powered applications, supporting businesses in building custom applications driven by data insights.

    Embedded Analytics

    Google Looker and Yellowfin BI can be utilized for embedded analytics, integrating analytical capabilities into other software applications.

    Accessibility and Analysis

    Users can access, analyze, and act on data with both Looker and Yellowfin BI, facilitating data-driven decision-making processes within organizations.

    Google Looker
    vs
    tool icon

    Google Looker vs. Yellowfin BI

    Self-Service and Governed BI

    Google Looker provides both self-service and governed business intelligence capabilities. Users have the flexibility to analyze data on their own while maintaining data governance. Yellowfin BI, on the other hand, may offer different levels of self-service and governance features.

    Data-Powered Applications

    Looker allows for the building of data-powered applications, a feature that may not be present or as developed in Yellowfin BI.

    Generative AI

    Google Looker includes a generative AI feature, which may not be available in Yellowfin BI.

    Embedded Analytics and Data Modeling

    Looker supports embedded analytics applications and data modeling, enabling integration into existing business applications, a feature that might differ in scope and implementation in Yellowfin BI.

    Chat with Business Data

    Looker provides the ability to chat with business data, potentially offering a more conversational and interactive experience compared to Yellowfin BI's capabilities.

    sourcetable

    Comparison of Google Looker, Yellowfin BI, and Sourcetable

    Google Looker

    Google Looker is a comprehensive business intelligence platform that provides both self-service and governed BI capabilities. It allows for the creation of data-powered applications and features generative AI. Looker enables access to, analysis of, and action on data, offering trusted data experiences. It supports embedded analytics applications, data modeling, organizational BI, self-service BI, workflow and application building, and chatting with business data.

    Yellowfin BI

    Yellowfin BI is a competitive analytics and business intelligence platform known for its storytelling features and collaborative capabilities. It does not inherently feature generative AI like Looker but focuses on dashboard and report creation, mobile BI, and automated reporting. Yellowfin excels in data visualization and has strong collaborative features for sharing insights.

    Sourcetable

    Sourcetable is a spreadsheet-like business intelligence tool designed for cross-database queries without the need for technical skills. Unlike Looker, it is more focused on accessibility for non-technical users and simplifies the process of data analysis. Sourcetable may not offer the depth of self-service BI and embedded analytics capabilities that Looker provides.

    Contrasts and Commonalities

  • Both Looker and Yellowfin BI cater to organizational business intelligence needs, but Looker also offers generative AI, which is not a noted feature of Yellowfin BI.
  • Looker and Sourcetable facilitate self-service BI, but Looker provides a broader set of tools for data-driven application development and embedded analytics.
  • While Looker and Yellowfin support embedded analytics, Sourcetable is more focused on data accessibility and ease of use for non-technical users.
  • sourcetable

    Frequently Asked Questions About Sourcetable

    What is Sourcetable and who typically uses it?

    Sourcetable is a spreadsheet application that is used by growth teams and business operations folks to centralize, analyze, and model data that updates over time. It replaces workflows traditionally done in Excel, Google Sheets, and Business Intelligence tools.

    Does Sourcetable require coding skills to use?

    No, Sourcetable does not require any coding skills to use. Users can query data and build live models without needing to code.

    How often does Sourcetable sync data from applications and databases?

    Sourcetable syncs data from over 100 applications and most databases every 15 minutes on the regular plan and every 5 minutes on the pro plan.

    What are the pricing plans for Sourcetable?

    Sourcetable costs $50 per month for the starter plan and $250 per month for the pro plan. Each additional seat costs $20 per month.

    Is there a trial period for Sourcetable?

    Yes, all plans of Sourcetable come with a 14-day free trial period.

    Google Looker

    Google Looker Pricing Structure

    • Platform Pricing

      Looker's platform pricing is the foundational cost associated with running a Looker instance. This includes expenses for platform administration, integrations, and semantic modeling capabilities essential for maintaining the Looker environment.

    • User Pricing

      User pricing relates to the licensing fees for each individual user accessing the Looker platform. These fees differ based on user roles and permissions, affecting the overall cost of using Looker.

    • Billing and Account Management

      Every Looker instance is linked to a dedicated billing account. Charges for the instance and additional named user licenses are billed to this account, aligning expenditure with usage.

    • Platform Editions and Cost Variation

      Looker offers three distinct platform editions: Standard, Enterprise, and Embed. The cost for each edition varies, reflecting the diverse needs and permissions of different user types within the Looker platform.

    • Subscription Terms

      Looker provides annual subscription packages with the flexibility of one, two, or three-year terms, allowing for cost predictability over the selected period.

    • License Types

      There are three license categories within Looker: Developer User, Standard User, and Viewer User. Each category has a specific cost structure based on the level of access and capabilities provided to the user.

    tool icon

    Yellowfin BI Cost Structure

    Yellowfin BI offers a pricing strategy designed to be simple, predictable, and scalable. This approach ensures clarity and transparency for businesses planning their investments in business intelligence tools.

    • Utility Pricing Model

      Aligned with sales approaches, Yellowfin provides a utility model that adjusts to the specific selling methods of different businesses.

    • Server Core Pricing Model

      For organizations focusing on server capabilities, Yellowfin has a server core pricing option that scales with the server resources used.

    • Revenue Share Pricing Model

      Businesses can benefit from a revenue share pricing model that correlates with the revenue generated, fostering mutual growth.

    • Embedded Analytics Pricing

      Yellowfin's pricing for embedded analytics is notably flexible, designed to fit various go-to-market models and ensure cost predictability and scalability.

    • No Hidden Costs

      With Yellowfin, companies can expect a transparent cost structure with no hidden fees, contributing to the overall predictability of expenses.

    Google Looker

    User Reviews of Google Looker

    User reviews highlight that Google Looker is a business intelligence (BI) and analytics platform with mixed feedback. Several users have criticized it as being the worst reporting tool available.

    • Common Complaints

    • Users report that Looker can be slow in performance.
    • There are complaints regarding bugs within the platform.
    • The platform has been described as unintuitive by some users.
    • Comparisons with Other Tools

      When compared with other BI tools, users express a preference for both free and paid alternatives. Products such as Data Studio and Tableau are often recommended over Looker.

    Conclusion

    Google Looker and Yellowfin BI offer distinct approaches to business intelligence. Looker provides a robust data platform with comprehensive analytics capabilities, while Yellowfin BI emphasizes user-friendly reporting and data visualization tools.

    For businesses seeking a more streamlined solution, Sourcetable offers real-time data syncing across services within a spreadsheet interface. This simplifies the business intelligence process, catering to those familiar with spreadsheet environments.


    Simplify Your BI Tooling

    Sourcetable is the AI spreadsheet that lets you analyze your data in one place. Get unlimited access free for 14 days.


    Drop CSV