Sourcetable vs Tableau: Which Platform Is Right for Your Team in 2026?
Tableau is the gold standard for enterprise BI dashboards. Sourcetable is the first AI spreadsheet with 100% benchmark scores, 500+ financial APIs, and real trading execution. This is an honest comparison of both.

Andrew Grosser
May 29, 2026 • 10 min read
If you're evaluating Tableau alternatives in 2026, you're not alone. Tableau remains the dominant enterprise BI platform — trusted by thousands of organizations — but its pricing model, learning curve, and lack of financial analysis tools are pushing teams to explore modern alternatives. This comparison is written by the Sourcetable team, so we'll be transparent: we think Sourcetable is the better choice for most analytical teams. But we'll show you exactly when Tableau wins too.
The Short Answer
| Factor | Sourcetable | Tableau |
|---|---|---|
| Benchmark Performance | ✅ 100% (Vals.ai finance + Rows.com) | ❌ Not benchmarked |
| Financial Data APIs | ✅ 500+ built-in (Bloomberg, Refinitiv) | ❌ Manual setup required |
| Trading Execution | ✅ Live via Robinhood | ❌ Not available |
| Pricing | ✅ Simple team pricing | ❌ $75 Creator / $42 Explorer / $15 Viewer |
| Learning Curve | ✅ Spreadsheet + natural language | ❌ Steep — requires training |
| Data Scale | ✅ 1 billion row data lake | ⚠️ Depends on data source |
| Visualizations | ⚠️ Good (ECharts, Plotly) | ✅ Industry-leading |
| Enterprise Governance | ⚠️ Standard | ✅ Mature, Salesforce-backed |
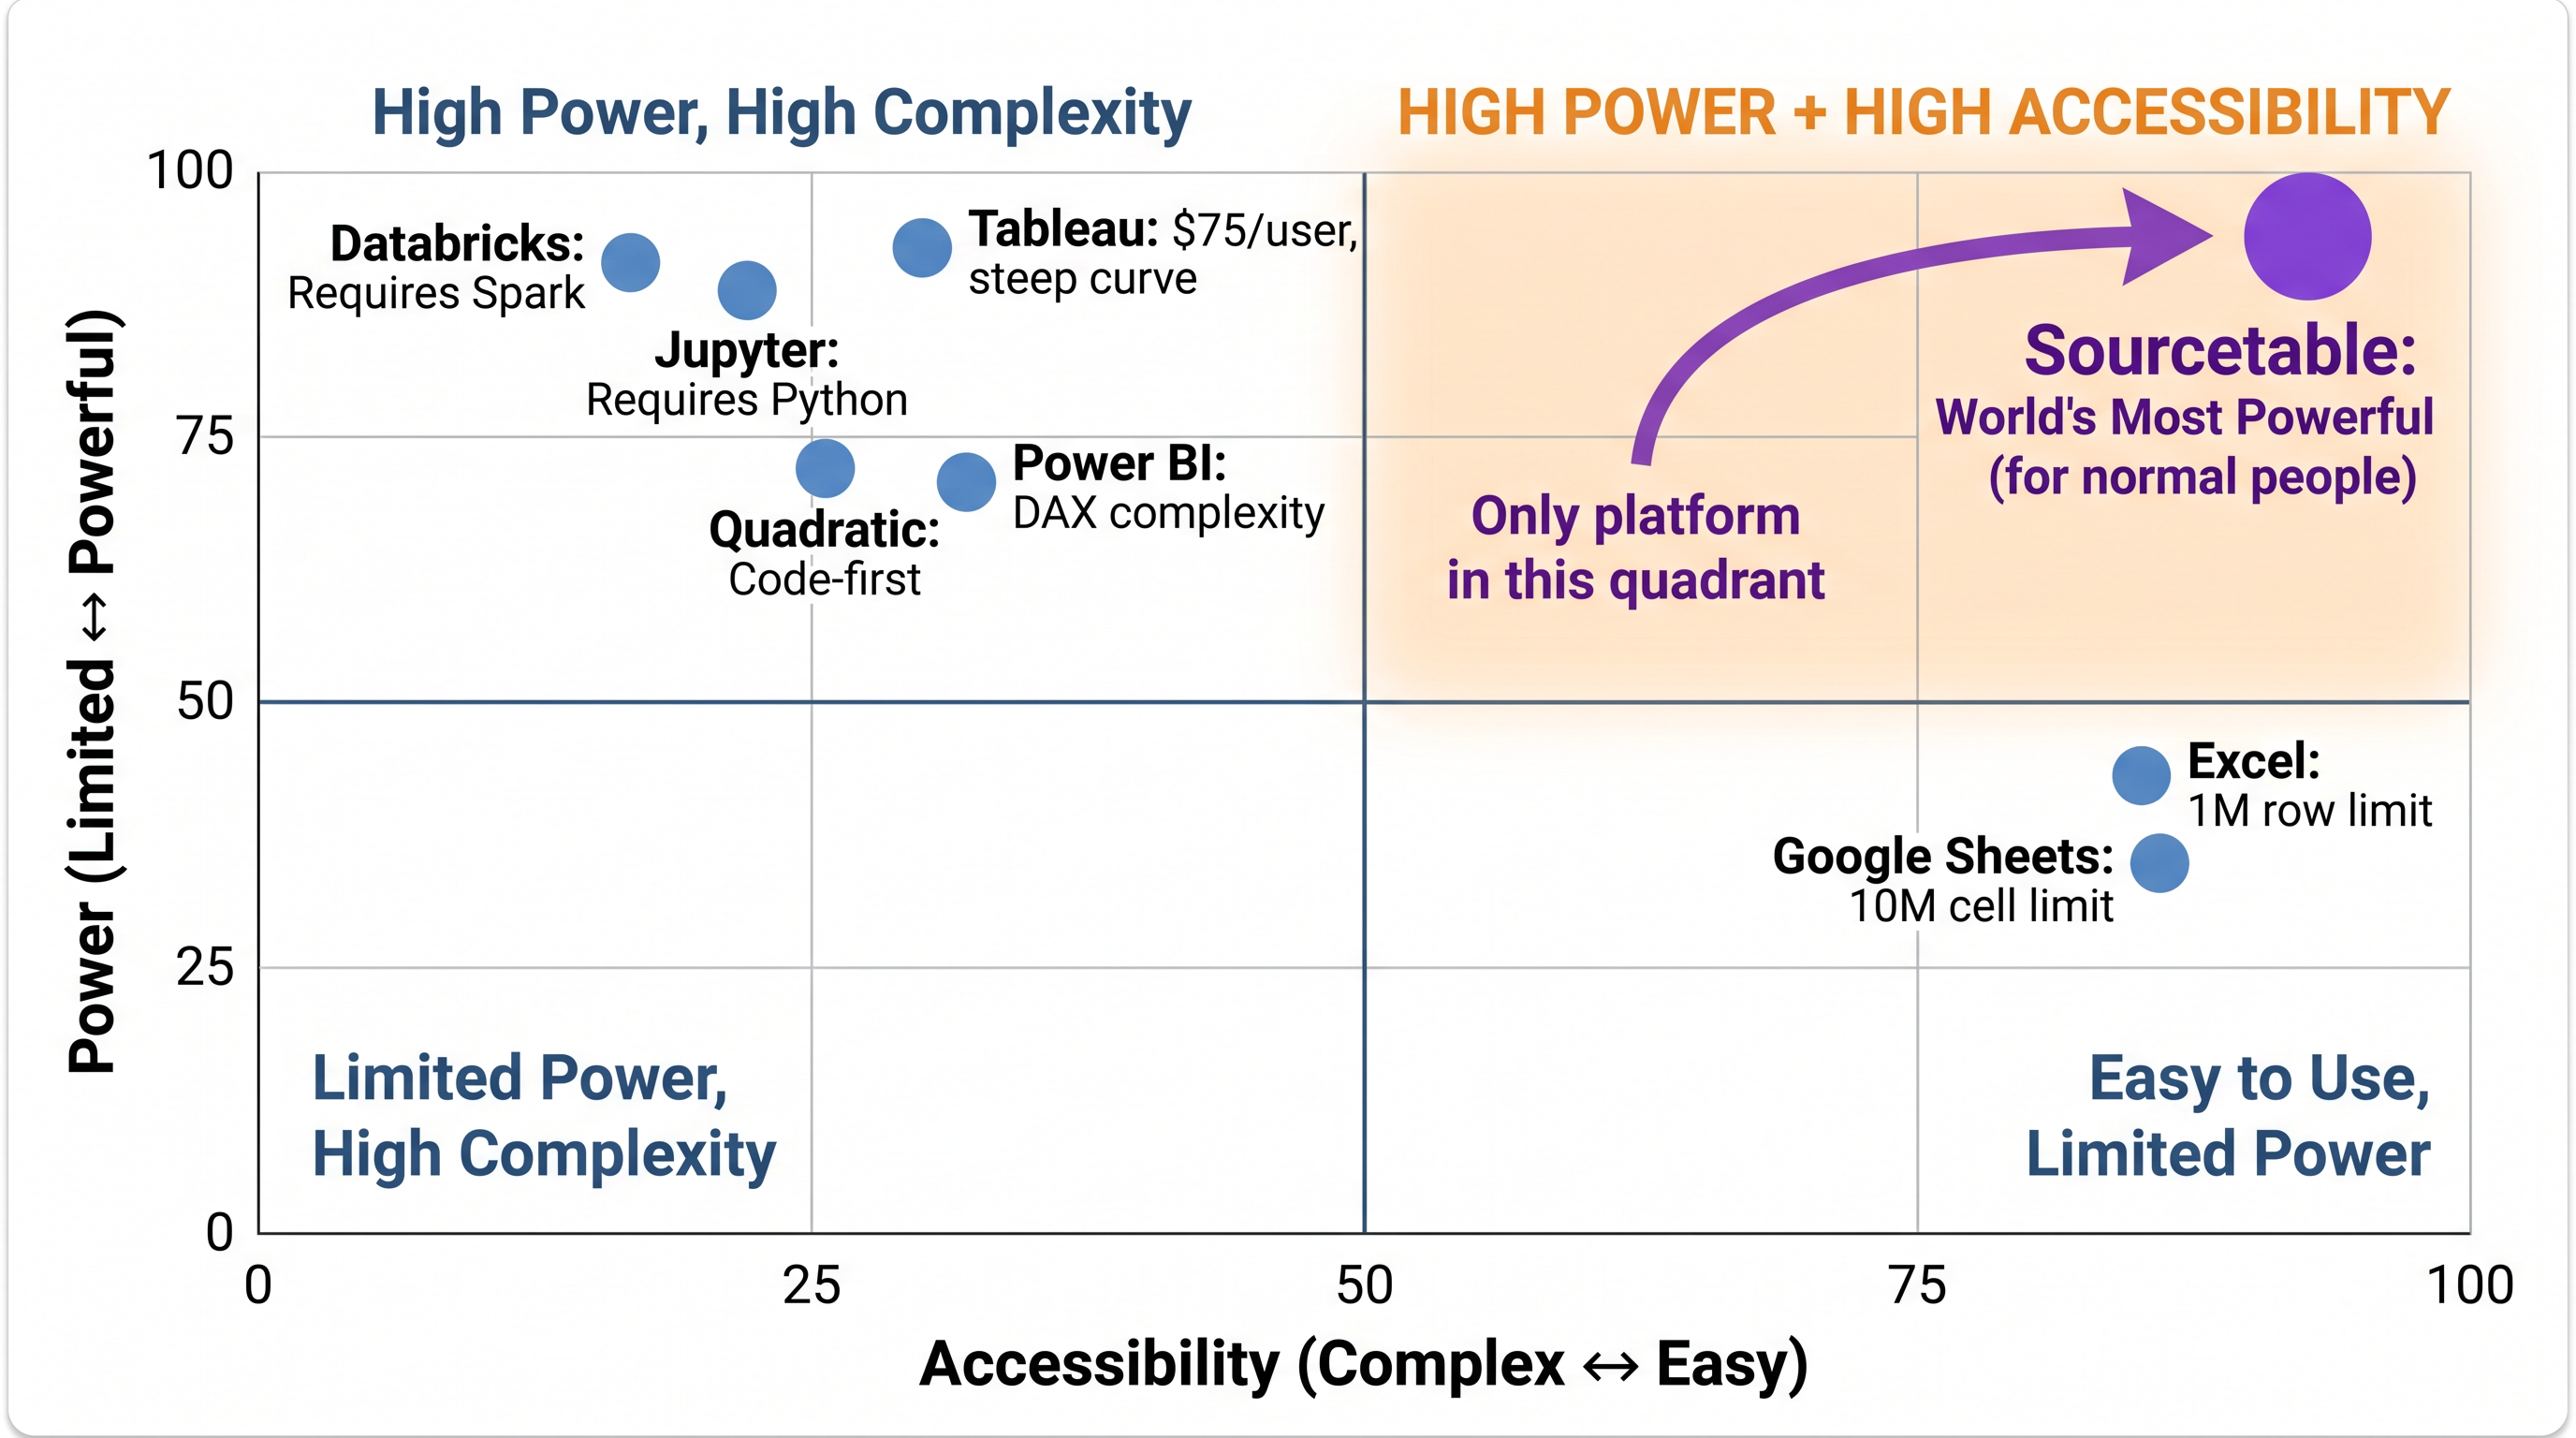
Sourcetable is the only analytical platform in the High Power + High Accessibility quadrant. Every competitor trades one for the other.
Pricing: The Biggest Difference
Tableau's pricing is notoriously complex. Users are split into three roles — Creator ($75/user/month), Explorer ($42/user/month), and Viewer ($15/user/month) — and you pay differently for each. Misclassify your users and you'll face unexpected license costs. For a team of 50 users (10 Creators, 20 Explorers, 20 Viewers), that's $45,000/year before you've written a single query.
Sourcetable uses simple team pricing — everyone on your team gets full creator capabilities. No role restrictions, no license math, no surprises at billing time.
💡 Cost Example: 50 Users for One Year
Tableau: $45,000+ (10 Creators × $75 + 20 Explorers × $42 + 20 Viewers × $15)
Sourcetable: Simple team pricing — all 50 users can create, explore, and analyze
Estimated savings: $36,000+/year
See for yourself why analysts choose Sourcetable over Tableau
100% benchmark scores. 500+ financial APIs. Free to try.
Start Free Trial →Benchmark Performance: The Proof
Sourcetable achieved 100% on the Vals.ai finance agent benchmark — the same benchmark where Claude Opus 4.5 scored 67%. We also achieved 100% on the Rows.com spreadsheet benchmark, making us the first AI spreadsheet to hit perfect scores on both. Tableau doesn't participate in these AI-specific benchmarks, which reflects the fundamental difference between the two platforms: Tableau is a BI visualization tool; Sourcetable is an AI-native analysis platform.
100%
Vals.ai Finance Benchmark
100%
Rows.com Spreadsheet Benchmark
67%
Claude Opus 4.5 (Vals.ai)
Financial Analysis: Sourcetable's Clear Advantage
Tableau is a general-purpose BI tool. It was not built for financial analysis. If you need to pull data from Bloomberg, run Monte Carlo simulations, backtest a portfolio strategy, or execute a trade — you need to build all of that yourself, stitching together APIs, Python scripts, and separate tools.
Sourcetable includes all of this out of the box. Our financial toolkit includes 500+ data APIs (Bloomberg, Refinitiv, FRED, SEC, and more), institutional-grade analysis tools (Monte Carlo simulations, portfolio backtesting, stress testing, Ray Dalio's Holy Grail portfolio construction), and live trading execution via Robinhood with PDT compliance and risk controls. None of this requires any setup — it's all part of the platform.
Technical Architecture: Built Differently
Sourcetable's architecture is fundamentally different from Tableau's. Our built-in data lake can query 1 billion rows in seconds. Our client-side processing engine handles multi-gigabyte datasets entirely in the browser — no cloud costs per query. We support multi-language code execution (C, C++, R, Python) via WebAssembly in a patent-pending sandboxed environment. We can perform cross-database joins across ClickHouse, Postgres, and MySQL with zero data movement.
Tableau processes data through its Hyper engine, which is excellent for BI workloads. But it requires data to be imported or connected via Tableau Prep, and it does not support the same multi-language execution or live trading capabilities that Sourcetable offers.
When Tableau Is the Better Choice
We want to be honest: Tableau wins in specific scenarios. If your primary need is complex, pixel-perfect data visualizations with advanced chart types — and you have a dedicated BI team trained on Tableau — the platform is genuinely excellent. Tableau's marketplace of extensions, its Salesforce ecosystem integration, and its mature enterprise governance features are real advantages for large organizations with established Tableau workflows.
Choose Tableau if:
- ✅ Your primary need is complex enterprise dashboards with advanced visualizations
- ✅ You have dedicated BI analysts trained on Tableau's interface
- ✅ You're already deep in the Salesforce ecosystem
- ✅ You need Tableau's specific visualization types (maps, complex charts)
When Sourcetable Is the Better Choice
Choose Sourcetable if:
- ✅ You need financial analysis with live data from 500+ APIs
- ✅ You want everyone on your team to analyze data without role-based license restrictions
- ✅ You need to query datasets larger than what fits in memory
- ✅ You want to execute trades directly from your analysis
- ✅ You prefer spreadsheet simplicity with natural language AI over Tableau's learning curve
- ✅ You want predictable pricing that doesn't multiply by Creator/Explorer/Viewer counts
- ✅ You need institutional-grade tools: Monte Carlo, backtesting, portfolio optimization
Migration: How Long Does It Take?
Most teams migrating from Tableau to Sourcetable are fully operational within 2-4 weeks. The spreadsheet interface is familiar to most users — there's no equivalent of Tableau's learning curve. Your live data connections are set up automatically through Sourcetable's 500+ API connectors. The primary transition effort is recreating dashboards in Sourcetable's format, which is straightforward for standard reporting workflows.
The Bottom Line
Tableau is an excellent product for what it was designed to do: enterprise BI dashboards with world-class visualizations. But if your team does financial analysis, needs live data connections, wants to execute trades, or simply wants everyone to be a creator without paying $75/user — Sourcetable is the more powerful and more accessible platform. We scored 100% on both major AI benchmarks. Tableau wasn't in the running.