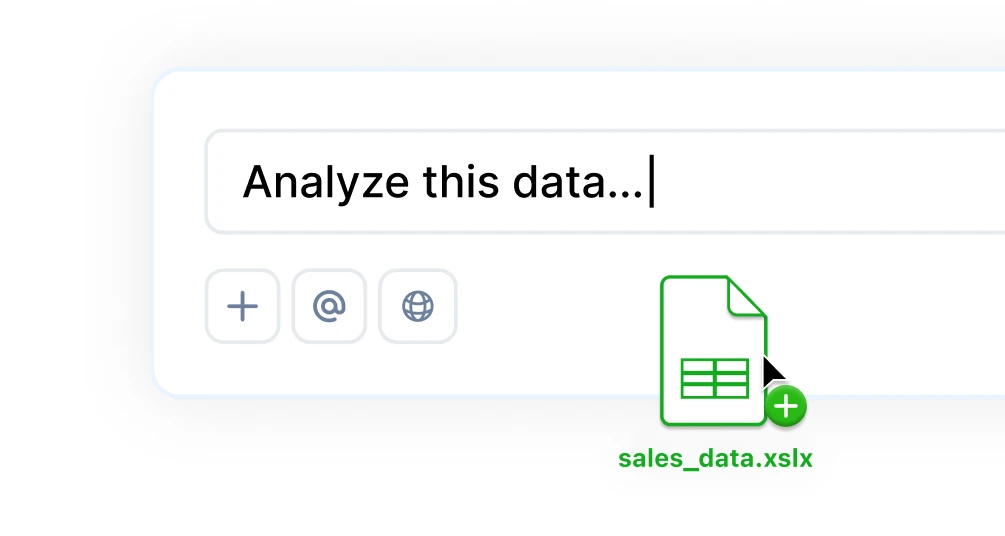
.xlsx
Fully Formatted


Nanoparticle size and zeta potential analyzer (DLS) for nanotechnology
Get your nanoPartica SZ-100V2 data into Sourcetable in 3 simple steps

Export your particle size distribution data from your nanoPartica SZ-100V2 via PC software export to CSV, XLSX (size distribution data, zeta potential results).

Import your analytical data into Sourcetable for advanced statistical processing and visualization.

Perform automated data analysis with statistical validation, trend analysis, and generate comprehensive analytical reports.
Complete support for nanoPartica SZ-100V2 particle size data with statistical distribution analysis.
.xlsx
Fully Formatted
.csv
Raw Data
Streamlined particle analysis workflows for nanotechnology with size distribution and quality control.
Laser diffraction measurement with Mie scattering theory and automated data processing
D10/D50/D90 calculations with volume and number distributions and statistical reporting
Batch comparison analysis with specification limits and trend monitoring
The last spreadsheet you.ll ever need.
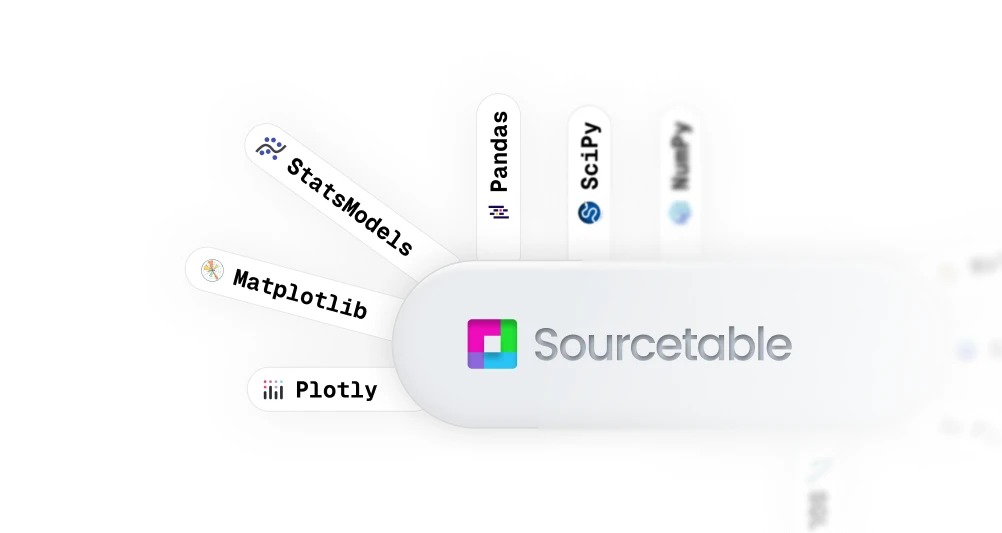
Sourcetable fuses AI smarts with Python’s full analytical power, so you can clean, query, model, and visualize data without switching tools or writing a single line of code. It’s everything you need, right where you need it.
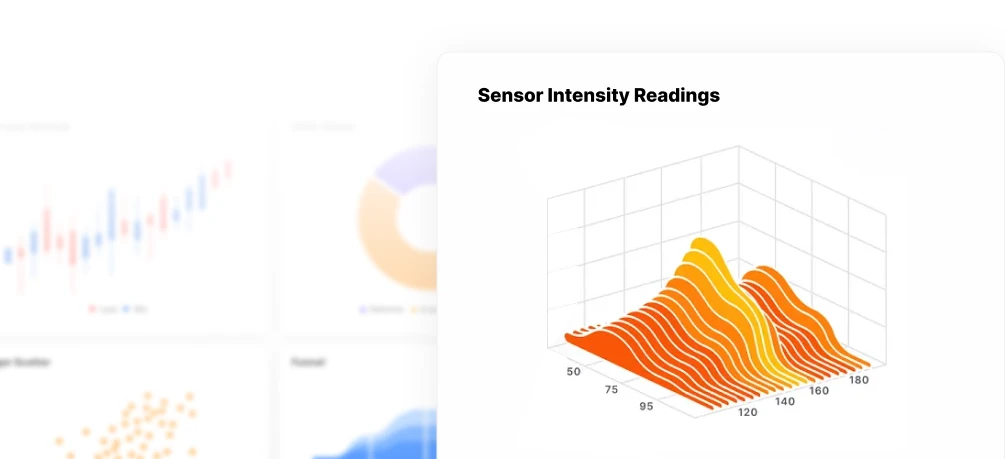
Turn data into charts & graphs instantly. Sourcetable helps you explore trends, uncover patterns, and present insights, automatically or on your terms.
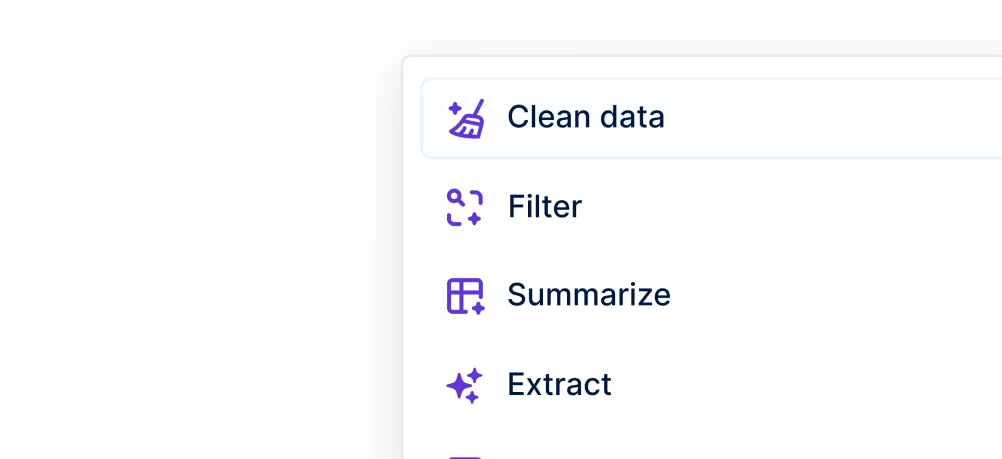
Clean, shape, and structure data with AI, formulas, or code. Sourcetable helps you go from raw input to ready-to-use datasets in seconds.
Ask questions in plain English, generate charts instantly, use Python for custom logic, and tap into built-in research tools for deeper insights.
