Enterprise-grade Security
Your data is protected by industry-leading SOC 2 Type 2, HIPAA, and PCI compliance standards, whether in our cloud or on-premises.
Private User Keys
Encrypted at REST
Escrow KMS
You've never seen a spreadsheet do this before.
| A | B | C | D | E | |
|---|---|---|---|---|---|
| 1 |
Repository
|
Commits
|
Updated
|
Contributors
|
Status
|
| 2 |
main-app
|
1,234
|
2025-12-14
|
12
|
Active
|
| 3 |
api-service
|
892
|
2025-12-14
|
8
|
Active
|
| 4 |
web-client
|
645
|
2025-12-13
|
15
|
Active
|
| 5 |
mobile-app
|
423
|
2025-12-13
|
Loading...
|
Building
|
| 6 |
data-pipeline
|
312
|
2025-12-12
|
6
|
Active
|
Use Sonarqube, show me latest data
— Operations Manager
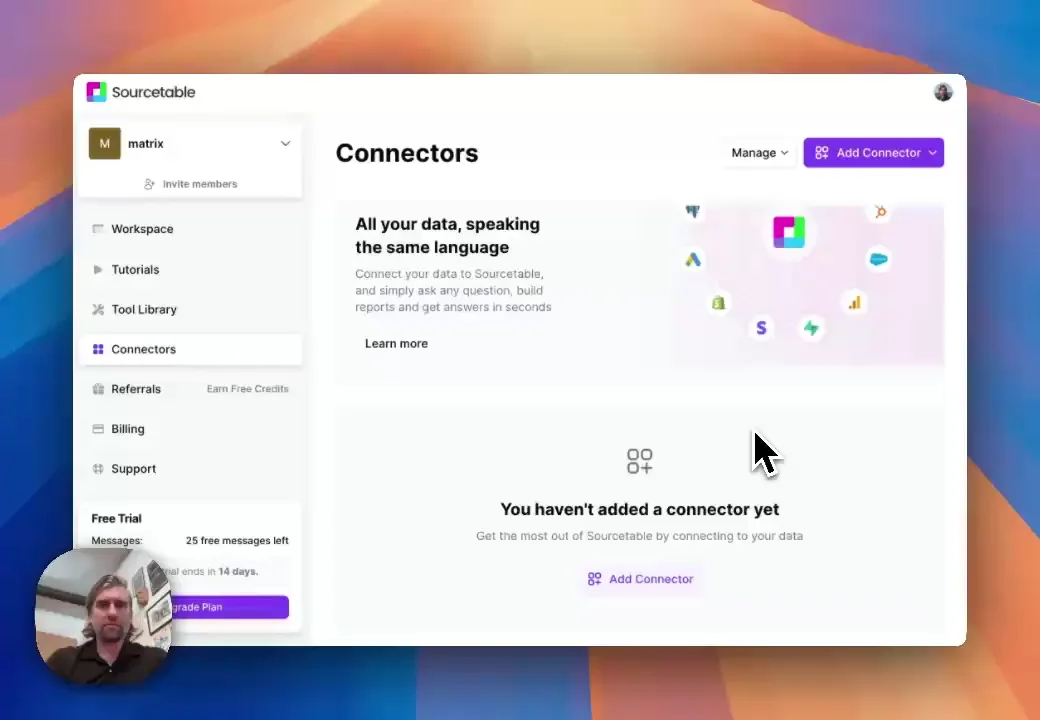
Just click and connect.
Your data is protected by industry-leading SOC 2 Type 2, HIPAA, and PCI compliance standards, whether in our cloud or on-premises.
Private User Keys
Encrypted at REST
Escrow KMS

Connect your most-used data sources and tools to Sourcetable for seamless analysis.
If your question is not covered here, you can contact our team.
Contact Us