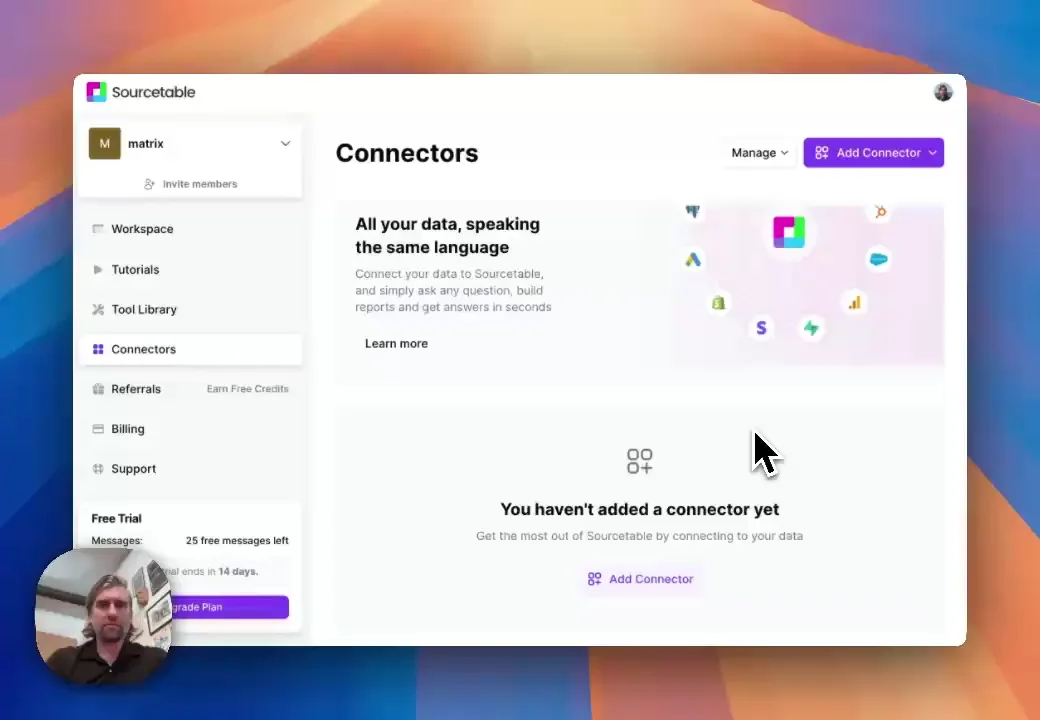

API Playground
Just add your 3rd party API keys or database credentials, and Sourcetable will do the rest.
Start connecting
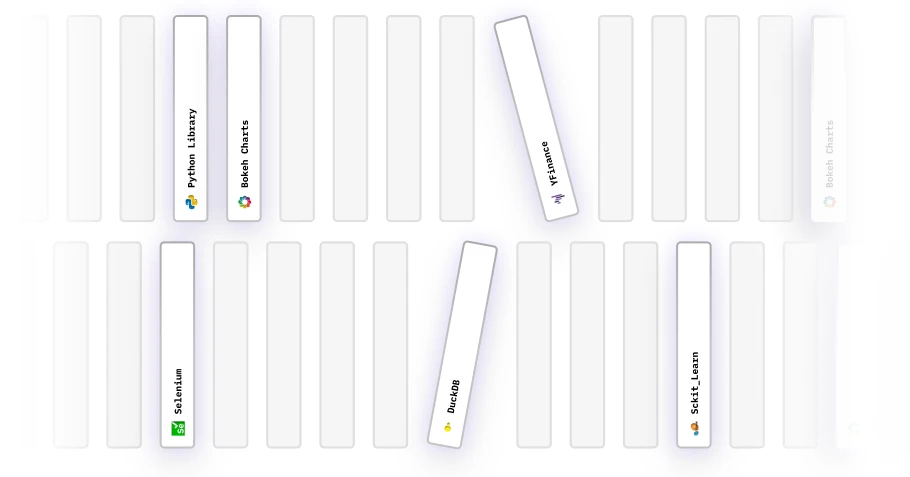
Tool Library
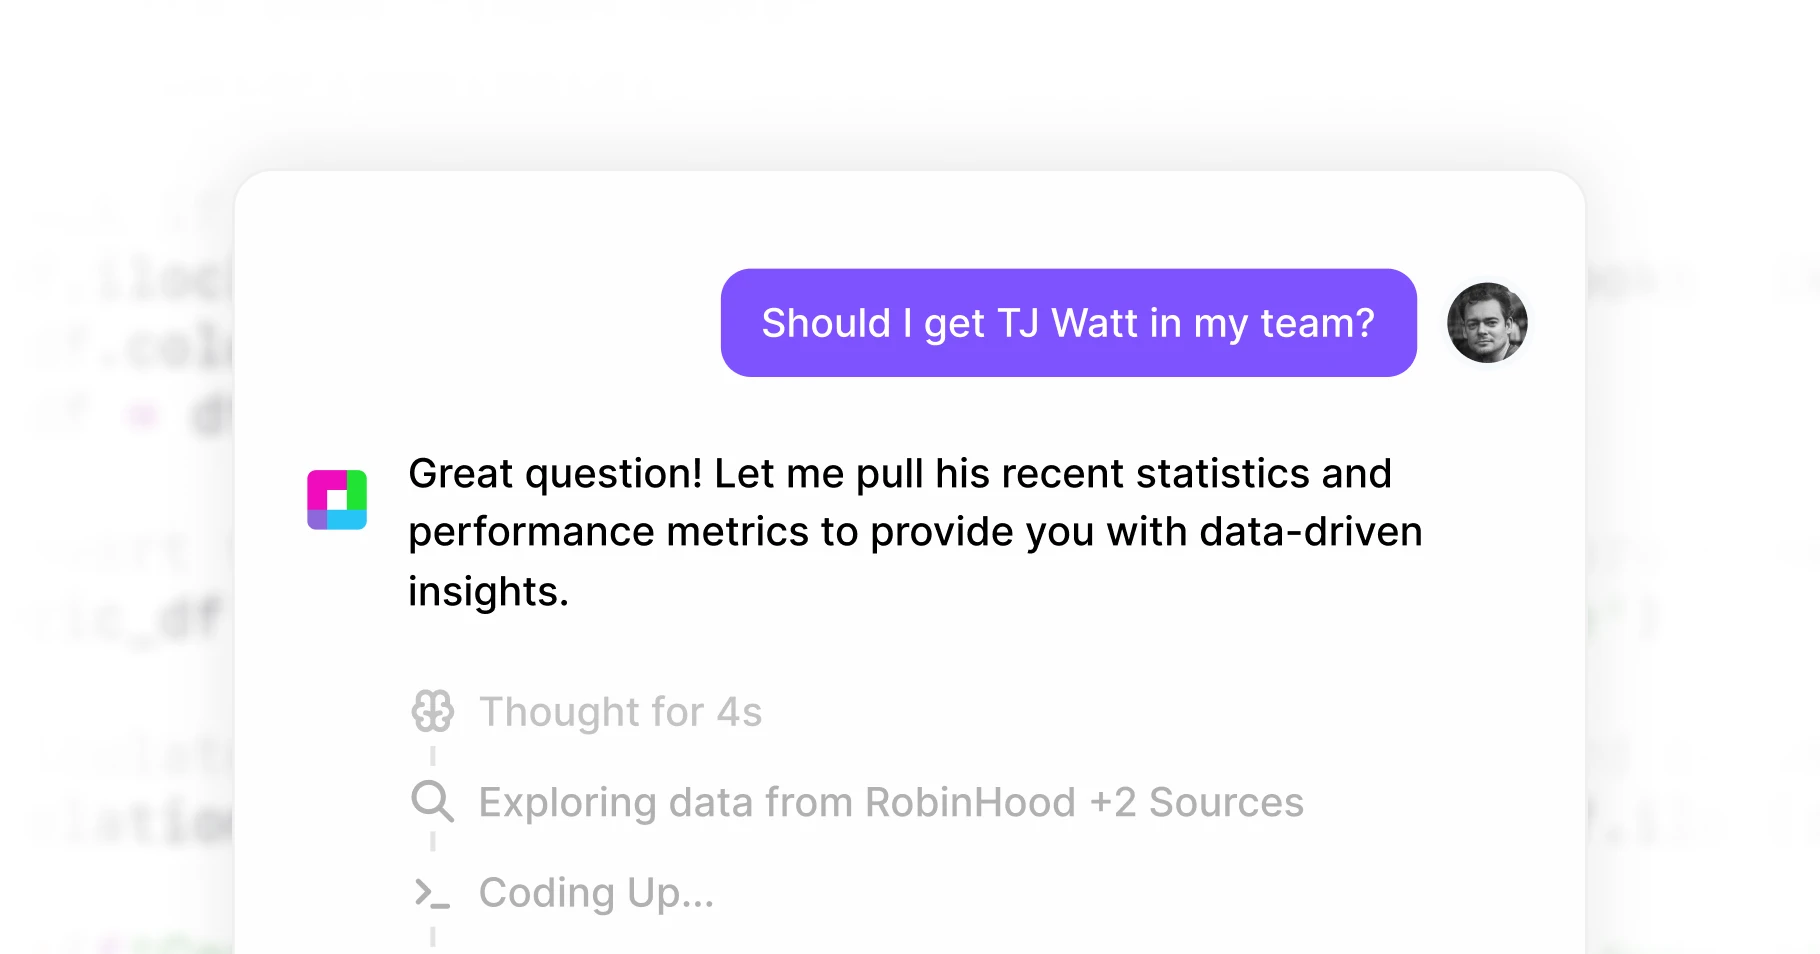
Hundreds of core tools and Agents Sourcetable's AI can leverage. Just ask for what you want. And let the magic happen.
Start connecting