Performance Analysis That Actually Makes Sense
Remember the last time your web application started crawling? Users complained, conversion rates dropped, and you spent hours digging through logs trying to figure out what went wrong. Web application performance analysis shouldn't be a detective story with a frustrating ending.
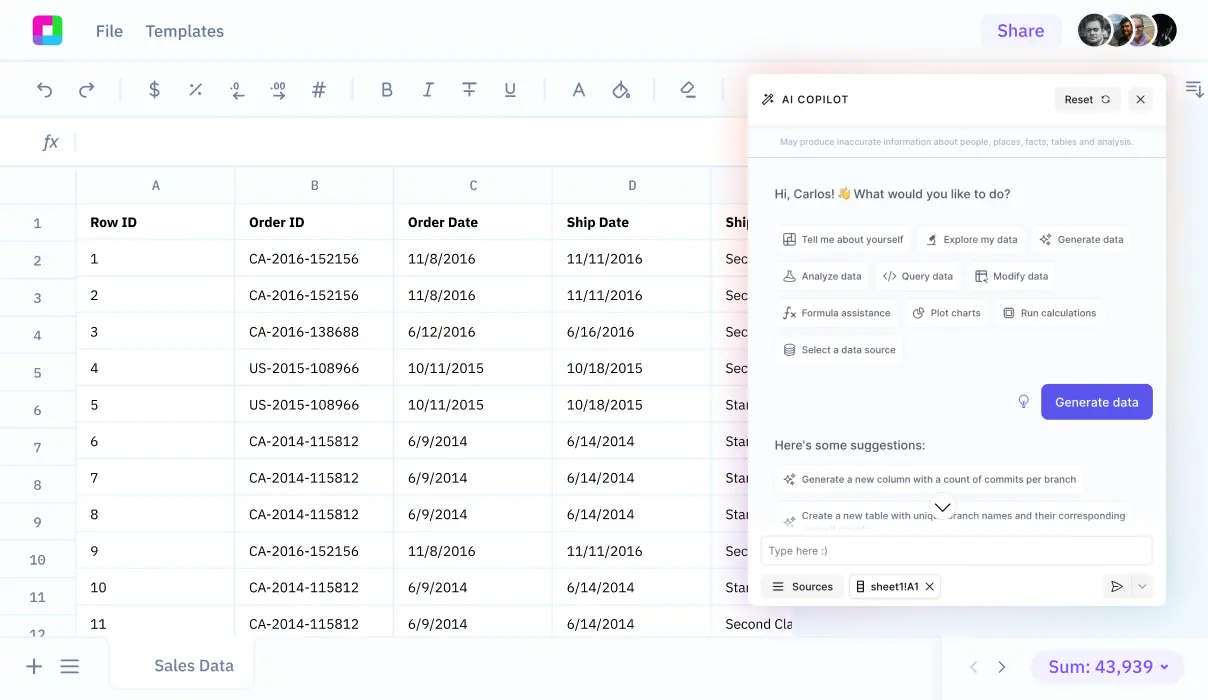
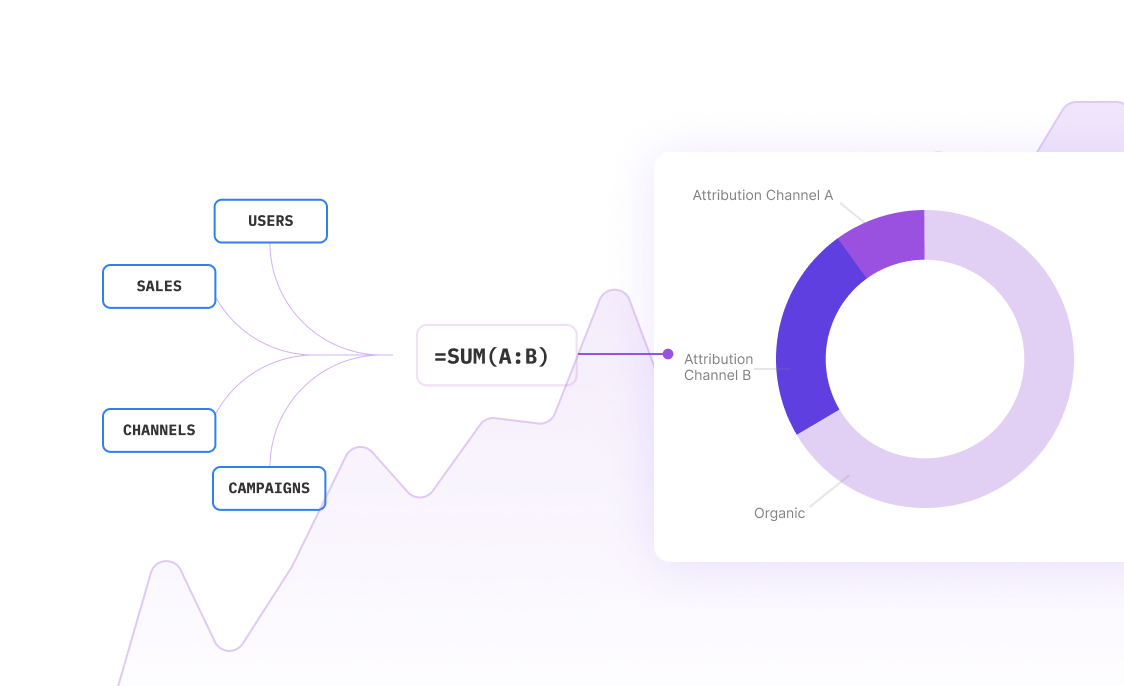
With Sourcetable, you can transform raw performance metrics into clear, actionable insights. Whether you're monitoring response times, analyzing throughput patterns, or identifying resource bottlenecks, our AI-powered analysis helps you understand what's really happening under the hood.
Why Performance Analysis Matters
Discover the key benefits
Proactive Issue Detection
Catch performance degradation before it impacts users. Identify trends and patterns that indicate potential problems.
Resource Optimization
Understand which components consume the most resources and optimize accordingly. Reduce costs while improving performance.
User Experience Insights
Correlate performance metrics with user behavior to understand the real impact of technical issues on business outcomes.
Capacity Planning
Use historical performance data to predict future resource needs and plan infrastructure scaling decisions.
Real-World Performance Analysis Examples
API Response Time Analysis
A growing e-commerce platform noticed their checkout process was becoming sluggish during peak hours. By analyzing API response times across different endpoints, they discovered that their payment processing API was experiencing 3x slower response times during high-traffic periods.
The analysis revealed that 95% of successful transactions completed within 2 seconds, but failed transactions took an average of 8 seconds before timing out. This insight led to implementing connection pooling and circuit breakers, reducing failed transaction response times by 60%.
Database Query Performance
A SaaS application was experiencing random slowdowns that seemed to correlate with user activity patterns. Performance analysis showed that certain database queries were taking exponentially longer as data volume increased.
By analyzing query execution times alongside table sizes and indexing strategies, the team identified that three specific queries accounted for 80% of database load during peak usage. Optimizing these queries reduced average page load times from 4.2 seconds to 1.8 seconds.
Memory Usage Patterns
A content management system was experiencing intermittent crashes that seemed random. Memory usage analysis revealed a pattern: crashes occurred consistently when memory consumption exceeded 85% of available RAM, typically during large file uploads or batch processing operations.
The analysis showed that memory usage spiked during specific user workflows, leading to implementation of streaming file processing and garbage collection optimizations that reduced peak memory usage by 40%.
Performance Analysis Use Cases
[object Object]
Try for freeHow to Analyze Web Application Performance
Discover the key benefits
Import Performance Data
Connect your monitoring tools, log files, or performance metrics databases. Sourcetable supports various data sources including APM tools, server logs, and custom metrics.
AI-Powered Analysis
Our AI automatically identifies patterns, anomalies, and correlations in your performance data. Get insights that would take hours to discover manually.
Visualize Trends
Create dynamic charts and dashboards that show performance trends over time. Identify seasonal patterns, usage spikes, and degradation trends.
Generate Reports
Automatically generate performance reports with key metrics, recommendations, and action items. Share insights with stakeholders and track improvements.
Essential Performance Metrics to Track
Response Time Metrics
- Average Response Time: Mean time to complete requests
- 95th Percentile: Response time that 95% of requests complete within
- 99th Percentile: Response time for the slowest 1% of requests
- Time to First Byte (TTFB): Time from request initiation to first response byte
Throughput and Capacity
- Requests Per Second (RPS): Number of requests handled per second
- Concurrent Users: Number of simultaneous active users
- Error Rate: Percentage of failed requests
- Queue Length: Number of pending requests waiting for processing
Resource Utilization
- CPU Usage: Processor utilization percentage
- Memory Consumption: RAM usage patterns and peak consumption
- Disk I/O: Read/write operations and throughput
- Network Bandwidth: Data transfer rates and network latency
Frequently Asked Questions
What data sources can I use for performance analysis?
Sourcetable supports various data sources including APM tools (like New Relic, Datadog), server logs, database performance metrics, CDN analytics, and custom monitoring solutions. You can import data via CSV, connect to databases, or use our API integrations.
How does AI help with performance analysis?
Our AI automatically identifies patterns, anomalies, and correlations in your performance data that might take hours to discover manually. It can detect performance degradation trends, predict capacity needs, and suggest optimization opportunities based on your specific usage patterns.
Can I analyze real-time performance data?
Yes, Sourcetable can handle both historical performance analysis and real-time monitoring data. You can set up automated imports to continuously analyze your application's performance and receive alerts when metrics exceed defined thresholds.
What types of performance bottlenecks can I identify?
You can identify various bottlenecks including slow database queries, inefficient API endpoints, memory leaks, CPU-intensive operations, network latency issues, and resource contention problems. The analysis helps pinpoint the root cause of performance issues.
How do I correlate performance metrics with business impact?
Sourcetable allows you to combine performance data with business metrics like conversion rates, user engagement, and revenue data. This helps you understand how technical performance directly impacts business outcomes and prioritize optimization efforts.
Can I create automated performance reports?
Yes, you can set up automated reports that generate performance summaries, trend analysis, and recommendations on a scheduled basis. These reports can be shared with stakeholders and used to track performance improvements over time.
