Picture this: It's 3 AM, and your network operations center is buzzing with alerts. Call drop rates are spiking, data throughput is plummeting, and customer complaints are flooding in. Sound familiar? Every telecommunications professional has been there – drowning in network performance data but struggling to extract the insights needed to act quickly.
Traditional network analysis tools often feel like trying to drink from a fire hose. Raw logs, complex metrics, and fragmented dashboards make it nearly impossible to see the forest for the trees. But what if you could transform that overwhelming data chaos into crystal-clear insights in minutes, not hours?
Transform Network Data Into Strategic Advantage
Turn complex telecommunications metrics into actionable insights that drive network optimization and improve customer experience.
Real-Time Performance Monitoring
Track network KPIs, latency metrics, and service quality indicators across all network elements with automated data processing and intelligent alerting.
Predictive Capacity Planning
Forecast network capacity needs, identify bottlenecks before they impact service, and optimize resource allocation using AI-powered trend analysis.
Service Quality Analysis
Analyze call quality metrics, data throughput patterns, and customer experience indicators to maintain optimal service levels and reduce churn.
Network Optimization Insights
Identify optimization opportunities, analyze traffic patterns, and generate recommendations for network configuration improvements.
Automated Reporting
Generate executive dashboards, regulatory compliance reports, and operational summaries automatically with customizable templates and scheduling.
Multi-Vendor Integration
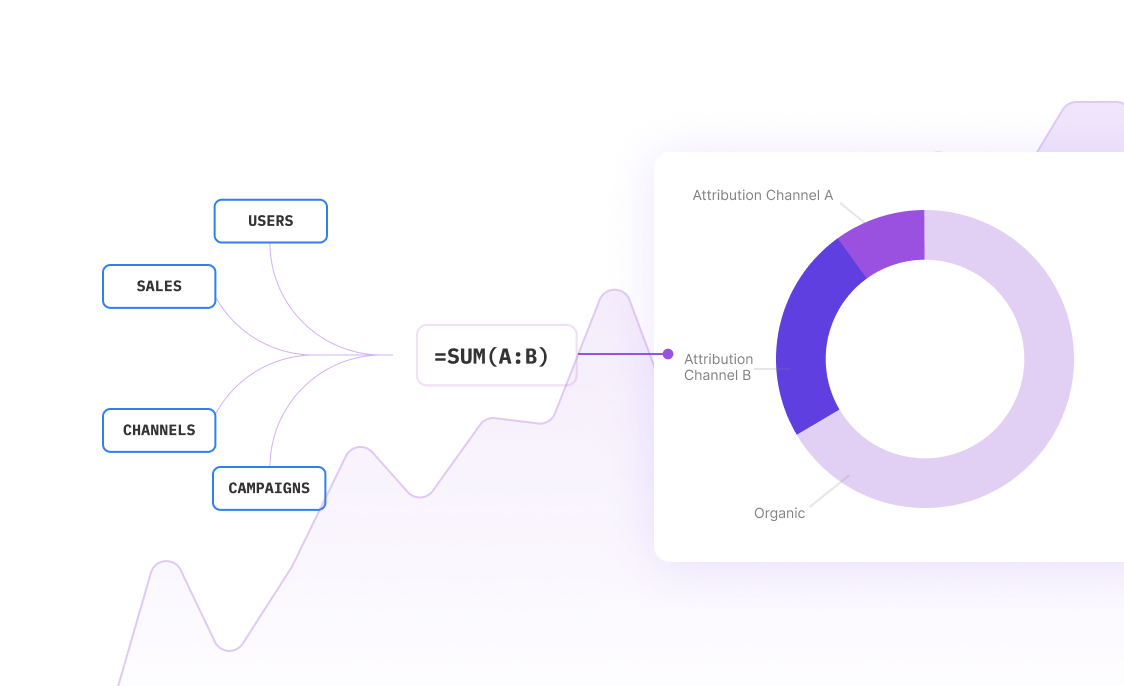
Consolidate data from multiple network equipment vendors, OSS/BSS systems, and monitoring tools into unified analysis workflows.
Real-World Network Analysis Scenarios
See how telecommunications professionals use Sourcetable to solve common network analysis challenges with practical examples.
Network Performance Dashboard Creation
A network operations team needed to create executive dashboards showing key performance indicators across their entire network infrastructure. Using Sourcetable, they connected data from multiple monitoring systems, created automated KPI calculations, and built interactive dashboards that update in real-time. The result? Leadership now has instant visibility into network health, and the team saves 15 hours per week on manual reporting.
Call Quality Analysis and Optimization
When customer complaints about call quality increased, a mobile network operator used Sourcetable to analyze millions of call detail records alongside network performance metrics. They identified specific cell towers with quality issues, correlated problems with network congestion patterns, and prioritized optimization efforts. This analysis led to a 40% reduction in call quality complaints within two months.
Capacity Planning for Network Expansion
A regional carrier needed to plan network capacity for expected subscriber growth. They used Sourcetable to analyze historical traffic patterns, forecast future demand by geographic region, and model different expansion scenarios. The AI-powered analysis revealed optimal locations for new cell sites and helped justify a $2M infrastructure investment to the board.
Service Level Agreement Monitoring
An enterprise network provider needed to track SLA compliance across hundreds of customer connections. They built automated SLA monitoring in Sourcetable that processes performance data, calculates compliance metrics, and generates customer-specific reports. The system now automatically identifies SLA violations and triggers corrective actions, improving customer satisfaction scores by 25%.
Network Fault Analysis and Root Cause Investigation
When experiencing intermittent network outages, a telecommunications company used Sourcetable to correlate fault data from multiple network layers. They analyzed alarm patterns, traffic flows, and equipment status logs to identify a systematic issue with firmware updates. This analysis prevented future outages and saved an estimated $500K in lost revenue.
Spectrum Efficiency Analysis
A wireless operator wanted to optimize spectrum utilization across their network. Using Sourcetable, they analyzed spectrum usage patterns, identified underutilized frequencies, and modeled reallocation scenarios. The analysis revealed opportunities to improve spectrum efficiency by 30% without additional hardware investments.
Your Network Analysis Workflow
From raw network data to actionable insights in four simple steps.
Connect Your Data Sources
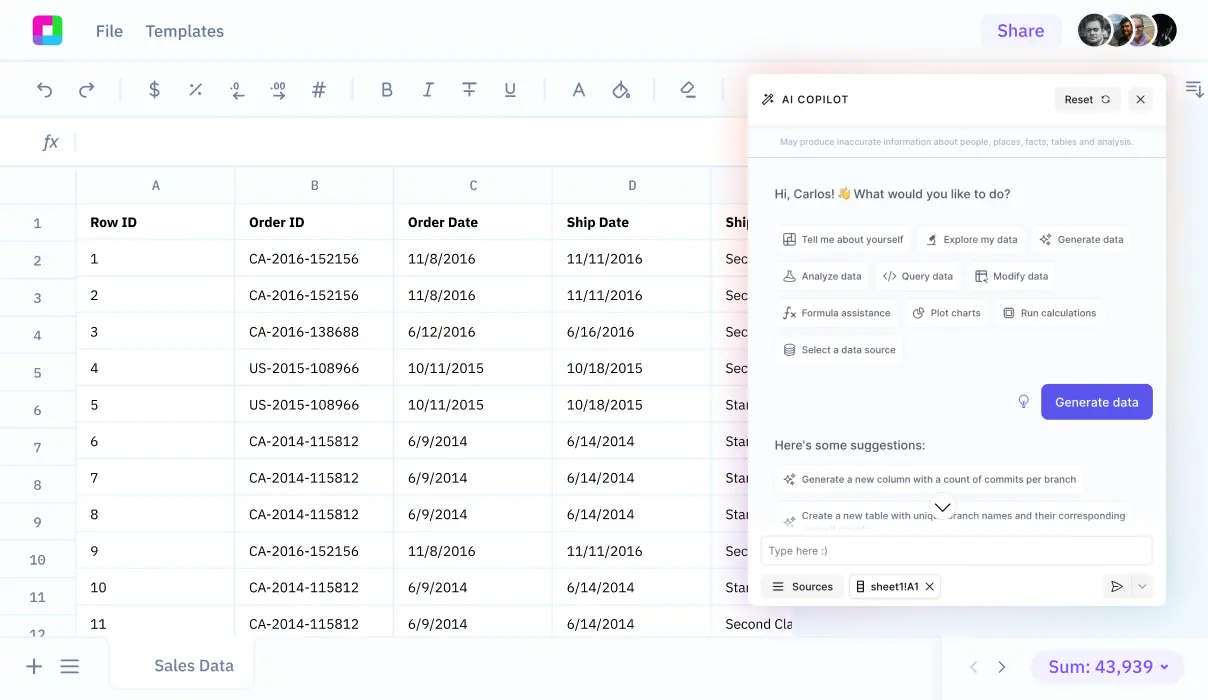
Import data from network monitoring systems, OSS/BSS platforms, call detail records, and equipment logs. Sourcetable handles multiple formats including SNMP data, CSV exports, database connections, and API feeds from major telecom vendors.
AI-Powered Data Processing
Let Sourcetable's AI automatically clean, normalize, and structure your network data. The system recognizes common telecom metrics, handles time-series data, and identifies key performance indicators without manual configuration.
Generate Insights and Analysis
Use natural language queries to explore your data. Ask questions like 'Which cell towers have the highest drop rates?' or 'Show me capacity utilization trends for the past month' and get instant answers with visualizations.
Create Reports and Dashboards
Build automated reports for different stakeholders – technical dashboards for operations teams, executive summaries for leadership, and compliance reports for regulatory requirements. Set up automated delivery and real-time monitoring alerts.
Essential Network Analysis Use Cases
Common telecommunications analysis scenarios where Sourcetable delivers immediate value.
Network Performance Monitoring
Monitor key performance indicators including latency, throughput, packet loss, and availability across all network elements. Set up automated alerts for threshold violations and trend analysis for proactive issue identification.
Customer Experience Analysis
Analyze customer-impacting metrics such as call setup success rates, data session quality, and service availability. Correlate customer complaints with network performance data to identify improvement opportunities.
Traffic Pattern Analysis
Study network traffic patterns to understand usage trends, identify peak usage periods, and optimize network configuration. Analyze seasonal variations and special event impacts on network performance.
Equipment Performance Tracking
Monitor individual network element performance, track equipment utilization, and identify devices requiring maintenance or replacement. Analyze failure patterns to improve preventive maintenance schedules.
Regulatory Compliance Reporting
Generate reports required by telecommunications regulators including service quality metrics, outage reports, and network availability statistics. Automate compliance calculations and ensure accurate, timely submissions.
Network Security Analysis
Analyze network traffic for security threats, unusual usage patterns, and potential vulnerabilities. Monitor for DDoS attacks, unauthorized access attempts, and abnormal data flows across the network infrastructure.
Frequently Asked Questions
Can Sourcetable handle large-scale telecommunications data?
Yes, Sourcetable is designed to process large volumes of telecommunications data including call detail records, network performance metrics, and equipment logs. The platform can handle millions of records and provides fast query performance for real-time analysis.
What network monitoring systems does Sourcetable integrate with?
Sourcetable integrates with major network monitoring platforms and can import data from SNMP sources, database connections, CSV files, and APIs. Common integrations include network management systems from major telecom equipment vendors and OSS/BSS platforms.
How does Sourcetable help with network capacity planning?
Sourcetable provides AI-powered trend analysis and forecasting capabilities that help predict future capacity needs. You can analyze historical usage patterns, model growth scenarios, and identify potential bottlenecks before they impact service quality.
Can I create automated reports for different stakeholders?
Absolutely. Sourcetable allows you to create different types of reports – technical dashboards for operations teams, executive summaries for leadership, and compliance reports for regulatory requirements. You can schedule automatic delivery and set up real-time alerts.
Is my network data secure in Sourcetable?
Yes, Sourcetable implements enterprise-grade security measures including data encryption, access controls, and compliance with industry security standards. Your sensitive network performance data is protected with the same security standards used by major telecommunications companies.
How quickly can I get insights from my network data?
With Sourcetable's AI-powered analysis, you can get insights within minutes of importing your data. The platform automatically recognizes common telecom metrics and can answer natural language questions about your network performance immediately.
Can Sourcetable help identify the root cause of network issues?
Yes, Sourcetable excels at correlation analysis across multiple data sources. You can analyze relationships between different network metrics, identify patterns in fault data, and trace issues across network layers to find root causes quickly.
What types of network KPIs can I track with Sourcetable?
You can track all standard telecommunications KPIs including call setup success rates, drop call rates, throughput, latency, packet loss, equipment utilization, spectrum efficiency, and customer experience metrics. Custom KPIs can also be easily created.
Frequently Asked Questions
If your question is not covered here, you can contact our team.
Contact Us