You know that sinking feeling when a deployment fails at 3 AM? Or when your team asks why releases are taking twice as long as last quarter? DevOps performance analysis isn't just about collecting metrics—it's about understanding the story your pipeline is telling you.
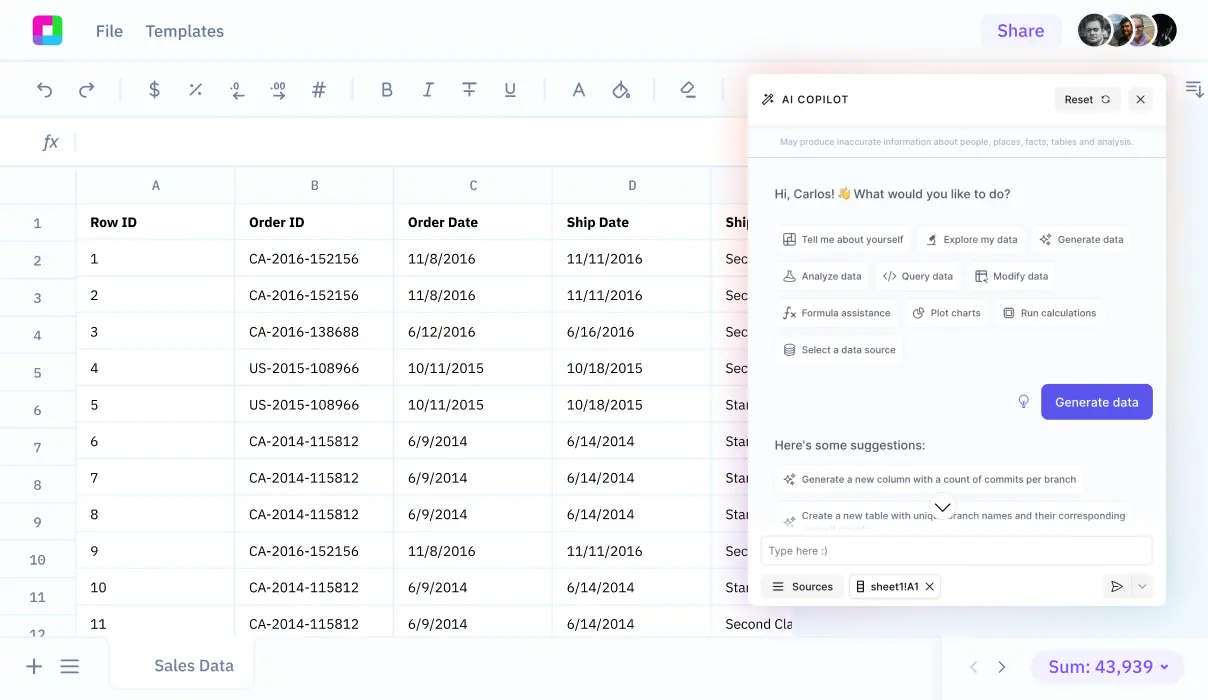
Traditional monitoring tools give you alerts. Sourcetable gives you answers. Transform your DevOps metrics into actionable insights with AI-powered analysis that actually makes sense.
Why DevOps Teams Choose Sourcetable
Stop drowning in metrics. Start making data-driven decisions that improve your delivery pipeline.
Real-Time Pipeline Insights
Connect your CI/CD tools and get instant visibility into deployment frequency, lead times, and failure rates. No complex dashboards to configure.
Bottleneck Detection
AI automatically identifies where your pipeline slows down. Spot test suite performance issues, approval delays, and infrastructure problems before they impact delivery.
Trend Analysis
Track performance over time with automated trend analysis. See if your latest optimization actually worked or if technical debt is creeping back in.
Team Performance Metrics
Understand team velocity without the politics. Get objective insights into code review times, deployment success rates, and capacity planning.
Cost Optimization
Identify expensive pipeline steps and optimize resource usage. Track infrastructure costs per deployment and find opportunities to reduce waste.
Compliance Reporting
Generate audit-ready reports for change management, security reviews, and compliance requirements. Export to any format your auditors need.
DevOps Performance Analysis in Action
Let's look at how different teams use Sourcetable to solve real DevOps challenges. These aren't theoretical examples—they're based on actual scenarios our users face daily.
Example 1: Deployment Frequency Analysis
A development team noticed their deployment frequency dropped from daily to weekly releases. Instead of pointing fingers, they imported their Git and CI/CD data into Sourcetable.
The analysis revealed that test suite runtime had increased by 40% over three months. Specific test categories were taking significantly longer, causing developers to batch changes to avoid frequent pipeline runs.
Data analyzed: Git commit timestamps, pipeline start/end times, test execution logs, deployment success rates
Key insight: The team identified that database setup for integration tests was the primary bottleneck. They implemented test data seeding optimization and saw deployment frequency return to daily releases within two weeks.
Example 2: Lead Time Optimization
An engineering manager wanted to understand why their lead time (code commit to production) had increased from 2 days to 5 days average.
Using Sourcetable's AI analysis, they discovered that code review wait times accounted for 60% of the total lead time. The issue wasn't review quality—it was availability.
Data analyzed: Pull request creation/merge times, reviewer assignment patterns, approval workflows, deployment schedules
Key insight: Most pull requests were created late Friday and waited until Monday for review. They implemented a policy encouraging mid-week code submissions and saw lead time drop to 2.5 days.
Example 3: Failure Rate Investigation
A platform team experienced a spike in deployment failures from 2% to 15% over a month. Traditional monitoring showed errors but not patterns.
Sourcetable's correlation analysis revealed that failures clustered around specific infrastructure changes and particular service combinations.
Data analyzed: Deployment logs, error rates by service, infrastructure change logs, dependency graphs
Key insight: A recent Kubernetes cluster upgrade introduced subtle networking latency that only affected services with tight timeout configurations. They adjusted timeout values and failure rates dropped to 1%.
From DevOps Data to Actionable Insights
Connect your tools, ask questions in plain English, and get AI-powered analysis that actually helps you make decisions.
Connect Your DevOps Stack
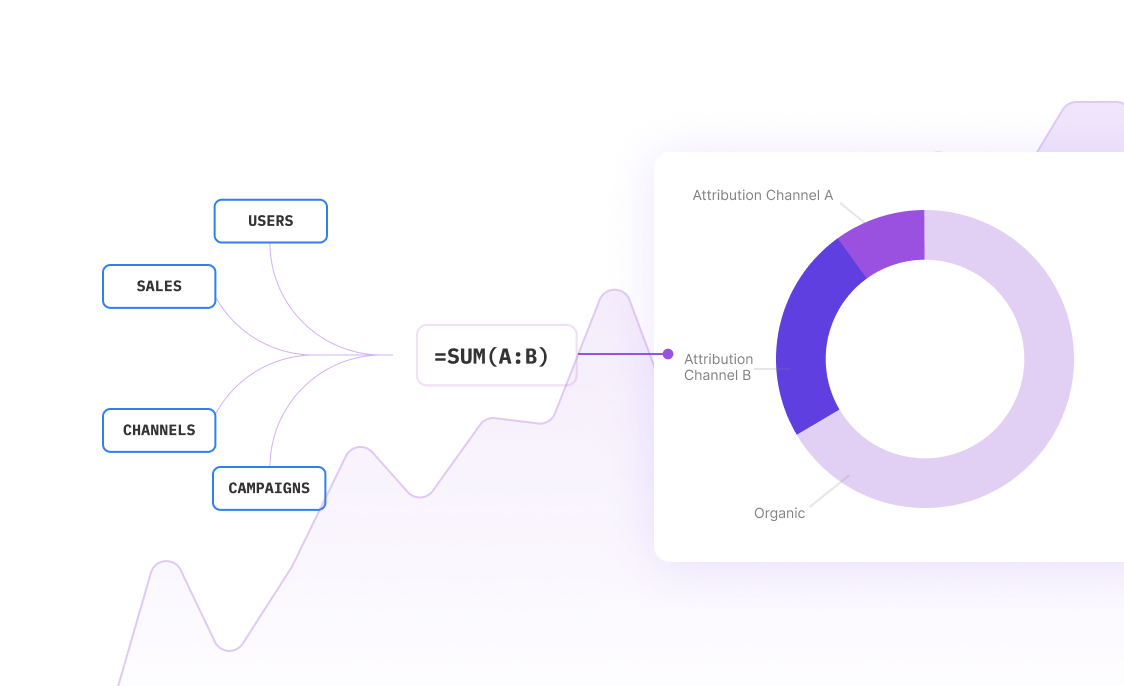
Import data from Git, Jenkins, GitHub Actions, CircleCI, Kubernetes, monitoring tools, and more. Sourcetable handles the data integration so you can focus on analysis.
Ask Natural Language Questions
Skip complex queries. Ask 'Why did our deployment frequency drop last month?' or 'Which services have the highest failure rates?' Get answers in seconds, not hours.
Get AI-Powered Insights
Our AI doesn't just show charts—it explains what's happening. Identify correlations, spot trends, and understand the root causes behind your metrics.
Share Findings with Your Team
Generate reports that make sense to both technical and business stakeholders. Export to slides, PDFs, or embed interactive charts in your documentation.
Common DevOps Performance Analysis Scenarios
Discover the key benefits
Pipeline Optimization
Identify slow steps in your CI/CD pipeline. Analyze build times, test execution duration, and deployment processes to optimize for speed and reliability.
Capacity Planning
Forecast infrastructure needs based on deployment patterns. Understand peak usage times and plan resource allocation for optimal performance.
Release Velocity Tracking
Monitor development team velocity across sprints and releases. Identify factors that accelerate or slow down feature delivery.
Quality Metrics Analysis
Correlate test coverage, code review thoroughness, and deployment success rates. Understand the relationship between quality practices and production stability.
Incident Response Analysis
Analyze mean time to recovery (MTTR) and incident patterns. Identify which changes correlate with production issues and improve change management processes.
Cost Optimization
Track cloud infrastructure costs per deployment, identify expensive pipeline steps, and optimize resource usage across your DevOps toolchain.
DevOps Data Sources Sourcetable Supports
Connect your existing DevOps tools without complex integrations. Sourcetable works with the data sources you're already using.
Version Control Systems
CI/CD Platforms
Infrastructure & Monitoring
Project Management
DevOps Performance Analysis FAQ
How quickly can I get insights from my DevOps data?
Most teams see their first insights within 30 minutes of connecting their data sources. Sourcetable automatically detects common DevOps metrics and starts generating analysis immediately. Complex correlation analysis typically completes within a few hours.
Do I need to change my existing DevOps tools?
No, Sourcetable works with your current toolchain. We integrate with popular CI/CD platforms, version control systems, and monitoring tools without requiring changes to your existing workflows or processes.
Can Sourcetable handle enterprise-scale DevOps data?
Yes, Sourcetable scales to handle large enterprise DevOps environments. We regularly process millions of commits, builds, and deployments for large development teams without performance issues.
How does AI analysis work for DevOps metrics?
Our AI identifies patterns, correlations, and anomalies in your DevOps data that would take hours to find manually. It can detect subtle relationships between code changes, infrastructure modifications, and performance impacts across your entire delivery pipeline.
Is my DevOps data secure in Sourcetable?
Security is our top priority. Sourcetable uses enterprise-grade encryption, supports single sign-on (SSO), and maintains SOC 2 Type II compliance. Your DevOps data never leaves our secure environment and access is strictly controlled.
Can I create custom DevOps dashboards and reports?
Absolutely. Beyond our pre-built DevOps analysis templates, you can create custom dashboards, automated reports, and specific metrics that matter to your team. Share insights with stakeholders through interactive reports or static exports.
How accurate is the bottleneck detection?
Our bottleneck detection uses statistical analysis and machine learning to identify performance constraints with high accuracy. It considers multiple factors including time-based patterns, resource utilization, and historical performance to pinpoint actual bottlenecks, not just slow steps.
Can Sourcetable help with DevOps compliance and auditing?
Yes, Sourcetable can generate comprehensive audit trails and compliance reports. Track change management processes, deployment approvals, security scan results, and maintain detailed records for regulatory requirements or internal audits.
Frequently Asked Questions
If your question is not covered here, you can contact our team.
Contact Us