Picture this: It's 3 AM, your production database is crawling, and users are abandoning your application faster than you can say "timeout error." You're drowning in execution plans, index statistics, and cryptic performance metrics that might as well be written in ancient hieroglyphics.
Sound familiar? Database query performance analysis doesn't have to feel like archaeological excavation. With the right approach and tools, you can transform from database detective to performance optimization wizard—without needing a PhD in database internals.
What is Database Query Performance Analysis?
Database query performance analysis is the systematic process of examining how your SQL queries execute, identifying performance bottlenecks, and optimizing database operations for maximum efficiency. Think of it as giving your database a comprehensive health checkup—measuring vital signs, diagnosing problems, and prescribing treatments.
At its core, query performance analysis involves three key components:
- Execution Plan Analysis: Understanding how the database engine processes your queries
- Resource Utilization Monitoring: Tracking CPU, memory, and I/O consumption
- Performance Metrics Collection: Measuring response times, throughput, and bottleneck identification
The beauty of modern query analysis lies in its ability to provide actionable insights without requiring you to memorize every obscure database configuration parameter or become fluent in execution plan hieroglyphics.
Why Query Performance Analysis Matters
Discover the key benefits
Faster Application Response
Transform sluggish queries into lightning-fast operations that keep users engaged and productive.
Reduced Infrastructure Costs
Optimize resource utilization to handle more load with existing hardware, delaying expensive upgrades.
Improved User Experience
Eliminate timeout errors and slow page loads that drive users away from your applications.
Scalability Planning
Identify performance bottlenecks before they become critical issues as your data and user base grow.
Proactive Issue Prevention
Catch performance degradation early through continuous monitoring and trend analysis.
Data-Driven Optimization
Make informed decisions about indexing, query rewriting, and database design based on real performance data.
Query Performance Analysis in Action
Example 1: The E-commerce Disaster
An online retailer was experiencing 30-second page load times during peak shopping hours. Their complex product search queries were performing full table scans across millions of records. Through performance analysis, they discovered:
- Missing composite indexes on frequently filtered columns
- Inefficient JOIN operations pulling unnecessary data
- Lack of query result caching for popular searches
Solution: Added targeted indexes, rewrote queries to use covering indexes, and implemented intelligent caching. Result: 95% reduction in query execution time and 400% improvement in page load speeds.
Example 2: The Analytics Nightmare
A data analytics platform was struggling with daily report generation taking over 6 hours to complete. Analysis revealed:
- Nested subqueries causing exponential performance degradation
- Aggregate functions running without proper indexing
- Inefficient date range filtering across partitioned tables
Solution: Restructured queries to use CTEs and window functions, added date-based partitioning strategies, and implemented columnar indexing. Result: Report generation time reduced from 6 hours to 15 minutes.
Example 3: The Real-Time Dashboard Crisis
A financial services company's real-time trading dashboard was showing stale data due to slow query performance. Investigation uncovered:
- Lock contention between read and write operations
- Inefficient polling queries hitting the database every second
- Missing read replicas for analytical workloads
Solution: Implemented read replicas, optimized polling queries with incremental updates, and added proper connection pooling. Result: Dashboard latency reduced from 5 seconds to under 100 milliseconds.
How to Perform Query Performance Analysis
Discover the key benefits
Collect Performance Metrics
Gather execution times, resource usage, and query frequency data from your database logs and monitoring tools.
Analyze Execution Plans
Examine how the database engine processes each query to identify inefficient operations and resource bottlenecks.
Identify Performance Patterns
Look for trends in slow queries, peak usage times, and recurring performance issues across your application.
Prioritize Optimization Opportunities
Focus on queries with the highest impact—those that are frequent, slow, or resource-intensive.
Implement and Test Solutions
Apply indexing strategies, query rewrites, and configuration changes while measuring performance improvements.
Monitor and Iterate
Continuously track performance metrics to ensure optimizations remain effective as data and usage patterns evolve.
Common Query Performance Scenarios
Discover the key benefits
E-commerce Product Search
Optimize complex product catalog queries with multiple filters, sorting options, and faceted search capabilities for faster customer browsing experiences.
Financial Reporting Systems
Accelerate complex aggregation queries across large datasets for regulatory reporting, financial analysis, and executive dashboards.
Real-Time Analytics Dashboards
Streamline queries powering live business intelligence dashboards that require sub-second response times for decision-making.
User Activity Tracking
Optimize queries that log and analyze user interactions, page views, and behavioral data for marketing and product insights.
Inventory Management Systems
Improve queries handling stock levels, reorder calculations, and supply chain analytics for efficient warehouse operations.
Customer Support Platforms
Enhance ticket search, customer history lookup, and knowledge base queries for faster customer service resolution.
Essential Query Analysis Tools and Techniques
Performance Monitoring Tools
- Database-specific tools: SQL Server Profiler, MySQL Performance Schema, PostgreSQL pg_stat_statements
- Third-party monitors: Application performance monitoring (APM) solutions that track database metrics
- Query analyzers: Tools that provide detailed execution plan analysis and optimization suggestions
Key Performance Metrics to Track
- Execution time: Total time from query start to completion
- CPU utilization: Processor resources consumed during query execution
- I/O operations: Disk reads and writes required for data retrieval
- Memory usage: RAM allocated for query processing and result sets
- Lock wait time: Time spent waiting for database locks to be released
- Query frequency: How often specific queries are executed
Analysis Techniques
- Execution plan analysis: Understanding query optimization paths and identifying inefficient operations
- Index utilization review: Checking which indexes are used effectively and identifying missing indexes
- Query pattern identification: Finding similar queries that could benefit from shared optimizations
- Resource bottleneck analysis: Determining whether performance issues stem from CPU, memory, or I/O constraints
Why Sourcetable Excels at Query Performance Analysis
Traditional database performance analysis often requires juggling multiple specialized tools, interpreting complex execution plans, and manually correlating metrics across different systems. Sourcetable transforms this complex process into an intuitive, AI-powered experience.
AI-Powered Query Optimization
Instead of manually parsing execution plans, simply describe your performance issue in natural language: "Why is my customer search query taking 10 seconds?" Sourcetable's AI analyzes your query patterns, identifies bottlenecks, and suggests specific optimizations with plain-English explanations.
Unified Analysis Dashboard
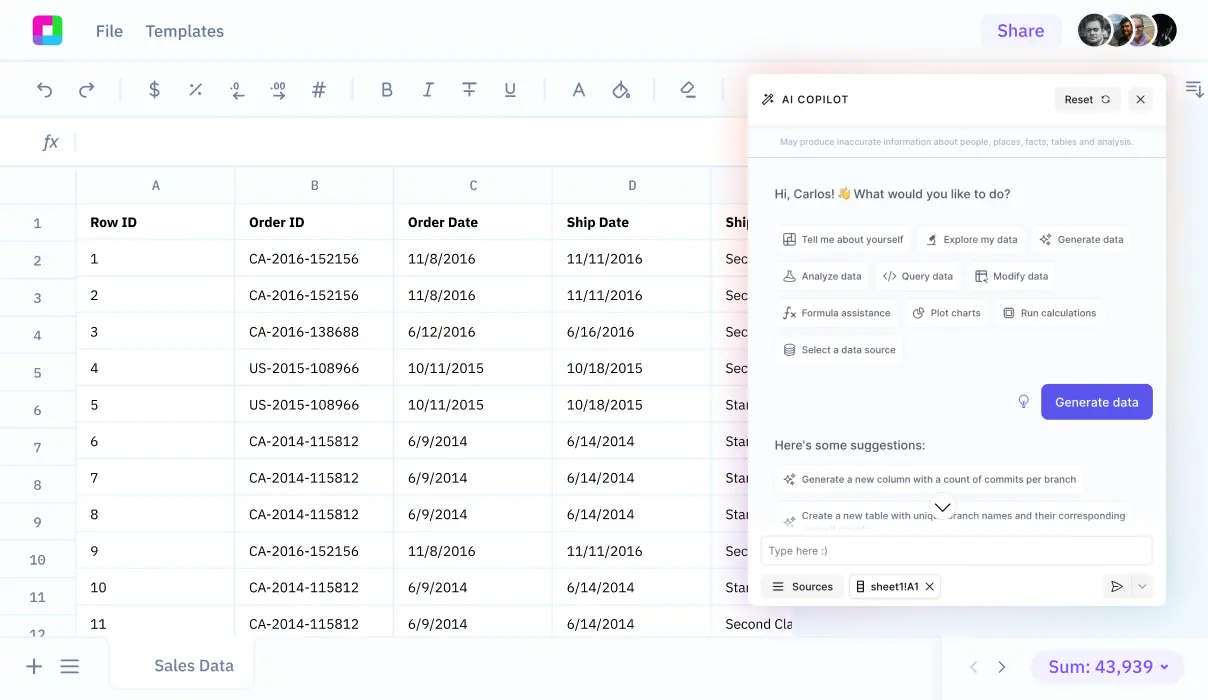
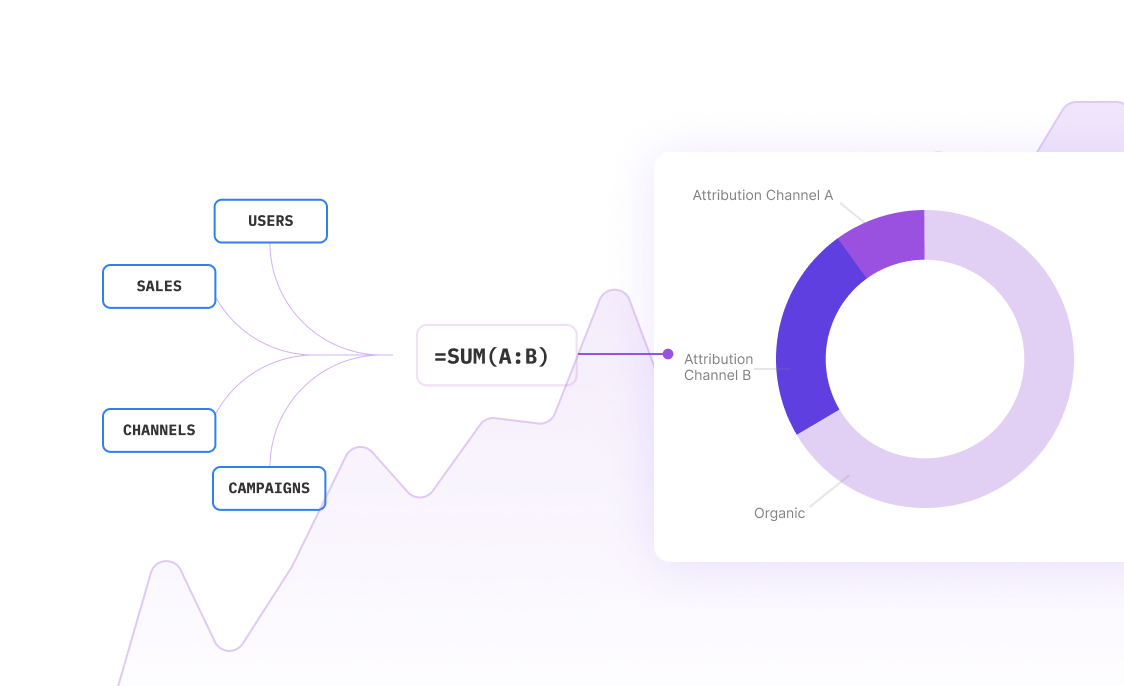
Connect multiple database sources—PostgreSQL, MySQL, SQL Server, Oracle—and analyze performance across your entire data infrastructure from a single interface. No more switching between database-specific tools or trying to correlate metrics across platforms.
Real-Time Performance Insights
Monitor query performance in real-time with automated alerting when response times exceed thresholds. Get instant notifications about performance degradation before users start complaining.
Collaborative Performance Reviews
Share performance analysis reports with your team using familiar spreadsheet interfaces. Developers, DBAs, and operations teams can collaborate on optimization strategies without needing specialized database tools.
Database Query Performance Best Practices
Query Design Principles
- Select only needed columns: Avoid SELECT * statements that retrieve unnecessary data
- Use appropriate WHERE clauses: Filter data as early as possible in query execution
- Limit result sets: Use LIMIT/TOP clauses for paginated results
- Optimize JOIN operations: Use proper JOIN types and ensure join conditions use indexed columns
Indexing Strategies
- Create covering indexes: Include all columns needed for a query in a single index
- Monitor index usage: Remove unused indexes that slow down write operations
- Use composite indexes wisely: Order columns by selectivity and query patterns
- Consider partial indexes: Index only subsets of data for specific query patterns
Ongoing Optimization
- Regular performance reviews: Schedule monthly analysis of query performance trends
- Test before production: Validate optimizations in staging environments with realistic data volumes
- Monitor after changes: Track performance metrics after implementing optimizations
- Document optimization decisions: Keep records of what works and what doesn't for future reference
Frequently Asked Questions
How often should I perform query performance analysis?
For production systems, implement continuous monitoring with weekly detailed reviews. Perform comprehensive analysis monthly or whenever you notice performance degradation. High-traffic applications may require daily monitoring of key performance metrics.
What's the most common cause of slow database queries?
Missing or inefficient indexes account for roughly 70% of query performance issues. Other common causes include inefficient JOIN operations, lack of query result caching, and retrieving more data than necessary with overly broad SELECT statements.
How do I prioritize which queries to optimize first?
Focus on queries with the highest impact: those that are both slow and frequently executed. Calculate impact by multiplying execution frequency by average response time. A query that runs 1000 times per hour and takes 2 seconds has higher impact than one that runs 10 times per hour and takes 10 seconds.
Can query optimization break existing functionality?
While optimization shouldn't change query results, poorly implemented changes can cause issues. Always test optimizations in staging environments, validate that results remain consistent, and have rollback plans ready. Focus on non-intrusive optimizations like adding indexes before rewriting queries.
What tools do I need for effective query performance analysis?
Essential tools include database-specific performance monitoring (like MySQL Performance Schema or SQL Server Query Store), execution plan analyzers, and application performance monitoring (APM) solutions. Sourcetable provides integrated analysis across multiple database platforms with AI-powered insights.
How do I measure the success of query optimizations?
Track key metrics before and after optimization: query execution time, CPU usage, I/O operations, and concurrent user capacity. Monitor these metrics for at least a week to account for varying load patterns. Successful optimization typically shows 20-50% improvement in response times.
Frequently Asked Questions
If your question is not covered here, you can contact our team.
Contact Us