Picture this: You're analyzing quarterly sales data when your database query takes 30 seconds to return results. Your stakeholder meeting is in 5 minutes, and you're watching a spinning wheel instead of actionable insights. Sound familiar?
Database performance optimization isn't just about making things faster—it's about unlocking the full potential of your data infrastructure. Whether you're dealing with slow queries, resource bottlenecks, or scaling challenges, the right analytical approach can transform your database from a liability into a competitive advantage.
Why Database Performance Optimization Analysis Matters
Modern businesses can't afford slow databases. Here's what proper optimization analysis delivers:
Cost Reduction
Identify inefficient queries and resource waste that inflate cloud computing costs by 40-60%
User Experience
Eliminate the 3-second rule—optimize response times to keep users engaged and productive
Scalability Planning
Predict and prevent performance bottlenecks before they impact business operations
Competitive Edge
Faster insights mean quicker decisions and better market responsiveness
Essential Performance Analysis Areas
Effective database performance optimization requires systematic analysis across multiple dimensions. Let's break down the critical areas that separate high-performing databases from sluggish ones.
Query Performance Analysis
The foundation of database optimization lies in understanding how your queries execute. This involves analyzing execution plans, identifying slow queries, and understanding resource consumption patterns. For example, a simple JOIN operation might seem innocuous, but without proper indexing, it could scan millions of rows unnecessarily.
Key metrics to track include query execution time, logical reads, physical reads, and CPU utilization per query. Tools like EXPLAIN PLAN in Oracle or EXPLAIN in MySQL provide crucial insights into how the database engine processes your queries.
Index Effectiveness Analysis
Indexes are the database's highway system—they can dramatically speed up data retrieval or create unnecessary overhead if poorly designed. Analysis should focus on index usage statistics, covering indexes (unused indexes consuming space), and missing index recommendations.
Consider this scenario: An e-commerce platform's product search was taking 8 seconds per query. Analysis revealed that searches on product categories weren't using any indexes. Adding a composite index on (category, price, availability) reduced search times to under 200 milliseconds.
Proven Database Optimization Techniques
Follow this systematic approach to identify and resolve performance bottlenecks:
Performance Baseline Establishment
Collect comprehensive metrics including response times, throughput, resource utilization, and error rates during normal operations. This baseline becomes your reference point for measuring improvement.
Bottleneck Identification
Use performance monitoring tools to identify the slowest queries, most resource-intensive operations, and system constraints. Focus on the 80/20 rule—typically 20% of queries consume 80% of resources.
Query Optimization
Rewrite inefficient queries, add appropriate indexes, and eliminate unnecessary data retrieval. Consider query hints, materialized views, and stored procedures for frequently-used operations.
Infrastructure Tuning
Optimize database configuration parameters, memory allocation, and storage systems. This includes buffer pool sizing, connection pool management, and disk I/O optimization.
Continuous Monitoring
Implement automated monitoring and alerting systems to catch performance degradation early. Regular performance reviews ensure optimizations remain effective as data volumes grow.
Database Optimization Success Stories
See how organizations transformed their database performance through strategic analysis:
E-commerce Platform Transformation
A growing online retailer faced 15-second page load times during peak hours. Performance analysis revealed inefficient product catalog queries and missing indexes. After optimization, page loads dropped to under 2 seconds, increasing conversion rates by 35% and reducing server costs by $50,000 annually.
Financial Services Reporting
A financial institution's end-of-day reporting took 8 hours to complete, delaying critical business decisions. Query analysis identified redundant calculations and poor join strategies. Optimization reduced reporting time to 90 minutes, enabling same-day decision making.
SaaS Application Scaling
A software company's application couldn't handle growing user demand, with database response times exceeding 10 seconds. Comprehensive analysis revealed connection pool exhaustion and inefficient data aggregation. Post-optimization, the system handles 10x more users with sub-second response times.
Analytics Dashboard Revival
A business intelligence dashboard became unusable due to 5-minute load times. Analysis showed that complex joins across multiple tables lacked proper indexing. Strategic index creation and query restructuring reduced dashboard load times to 15 seconds, restoring user adoption.
Advanced Database Performance Analysis Techniques
Beyond basic query tuning lies a world of sophisticated optimization strategies that can yield dramatic performance improvements. These advanced techniques require deeper analysis but offer substantial returns on investment.
Partitioning Strategy Analysis
Large tables can benefit enormously from partitioning—dividing data into smaller, more manageable segments. Analysis should evaluate partitioning candidates based on data access patterns, query filtering, and maintenance requirements.
For instance, a logistics company with 500 million shipment records implemented date-based partitioning. Queries filtering by shipment date now access only relevant partitions, reducing query times from minutes to seconds. The key is analyzing which columns are most frequently used in WHERE clauses.
Caching Strategy Optimization
Modern databases offer multiple caching layers, from buffer pools to query result caches. Analysis should identify frequently accessed data, cache hit ratios, and memory utilization patterns to optimize caching strategies.
Consider implementing application-level caching for read-heavy workloads. A news website reduced database load by 70% by caching article content for 15 minutes—long enough to handle traffic spikes but short enough to ensure content freshness.
Replication and Sharding Analysis
For high-traffic applications, distributing database load across multiple servers becomes essential. Analysis should evaluate read/write patterns to determine optimal replication strategies and identify natural sharding boundaries.
Essential Performance Metrics to Monitor
Track these critical metrics to maintain optimal database performance:
Query Response Time
Average and 95th percentile response times for different query types. Aim for sub-second response for OLTP systems and reasonable times for analytical workloads.
Throughput (QPS/TPS)
Queries per second and transactions per second indicate system capacity. Monitor trends to predict when scaling becomes necessary.
Resource Utilization
CPU, memory, disk I/O, and network utilization help identify bottlenecks. High utilization in any area can indicate optimization opportunities.
Lock Contention
Lock wait times and deadlock frequency reveal concurrency issues. High contention suggests need for query optimization or schema redesign.
Cache Hit Ratios
Buffer pool and query cache hit ratios indicate memory efficiency. Low hit ratios suggest need for memory tuning or query optimization.
Connection Pool Health
Active connections, connection wait times, and pool exhaustion events help optimize connection management and prevent access issues.
How Sourcetable Supercharges Database Performance Analysis
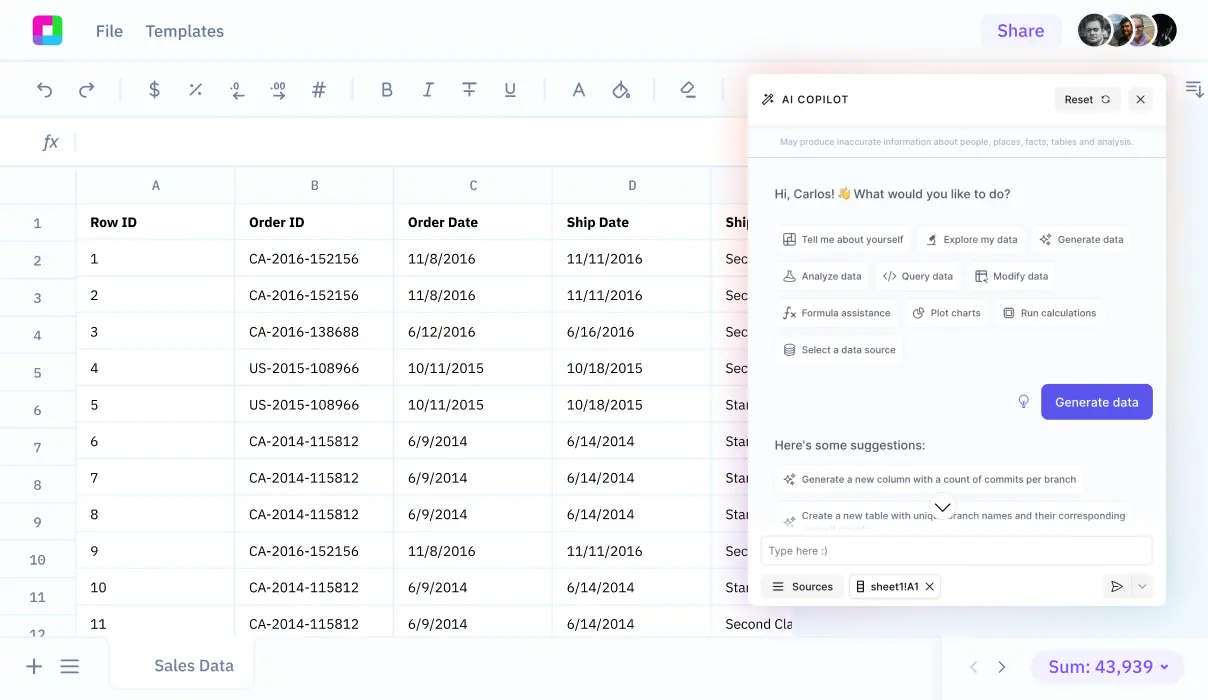
Traditional database performance analysis requires juggling multiple tools, complex queries, and manual correlation of metrics. Sourcetable transforms this process by bringing AI-powered analysis directly to your fingertips.
Automated Performance Insights
Instead of writing complex monitoring queries, simply ask Sourcetable: "Show me the slowest queries from the last week" or "Which indexes are underutilized?" The AI understands your database schema and generates appropriate analysis automatically.
Visual Performance Dashboards
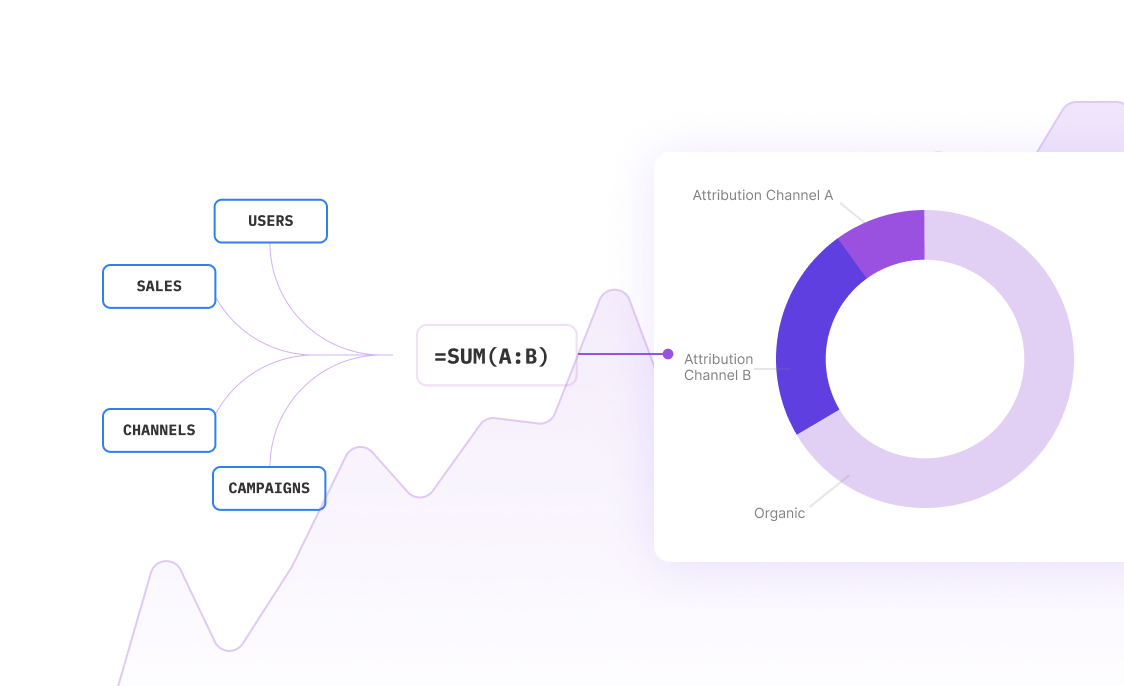
Transform raw performance metrics into compelling visualizations. Create real-time dashboards that track key performance indicators, identify trends, and alert you to anomalies—all without writing a single line of code.
Collaborative Analysis
Share performance insights with your team using familiar spreadsheet interfaces. DBAs, developers, and managers can all access the same data with different views tailored to their needs. Comments and annotations keep everyone aligned on optimization priorities.
Database Performance Optimization FAQ
How often should I perform database performance analysis?
Continuous monitoring is ideal, with comprehensive analysis monthly or quarterly. However, perform immediate analysis if you notice performance degradation, after schema changes, or during capacity planning exercises.
What's the biggest mistake in database performance optimization?
Optimizing without understanding the workload. Many teams add indexes or tune parameters without analyzing actual usage patterns. Always start with comprehensive performance profiling to identify real bottlenecks.
How do I prioritize which performance issues to fix first?
Focus on high-impact, low-effort optimizations first. Target the most frequently executed slow queries, eliminate obvious inefficiencies like missing indexes on foreign keys, and address resource bottlenecks affecting multiple operations.
Can database performance optimization affect data integrity?
Proper optimization improves both performance and reliability. However, avoid shortcuts like disabling transaction logging or foreign key constraints. Always test optimizations thoroughly in staging environments before production deployment.
How do I measure the ROI of database optimization efforts?
Track metrics like reduced infrastructure costs, improved user satisfaction scores, decreased support tickets, and faster business process completion times. Document baseline performance before optimization to demonstrate clear improvements.
What tools are essential for database performance analysis?
Essential tools include database-specific profilers (like SQL Server Profiler or MySQL Performance Schema), system monitoring tools, and query execution plan analyzers. Modern platforms like Sourcetable integrate these capabilities with AI-powered insights for comprehensive analysis.
Frequently Asked Questions
If your question is not covered here, you can contact our team.
Contact Us