Picture this: It's 2 AM, your application is crawling, and users are abandoning their shopping carts faster than you can say "timeout error." Sound familiar? Database performance issues don't just hurt your bottom line—they can turn a promising product launch into a digital disaster.
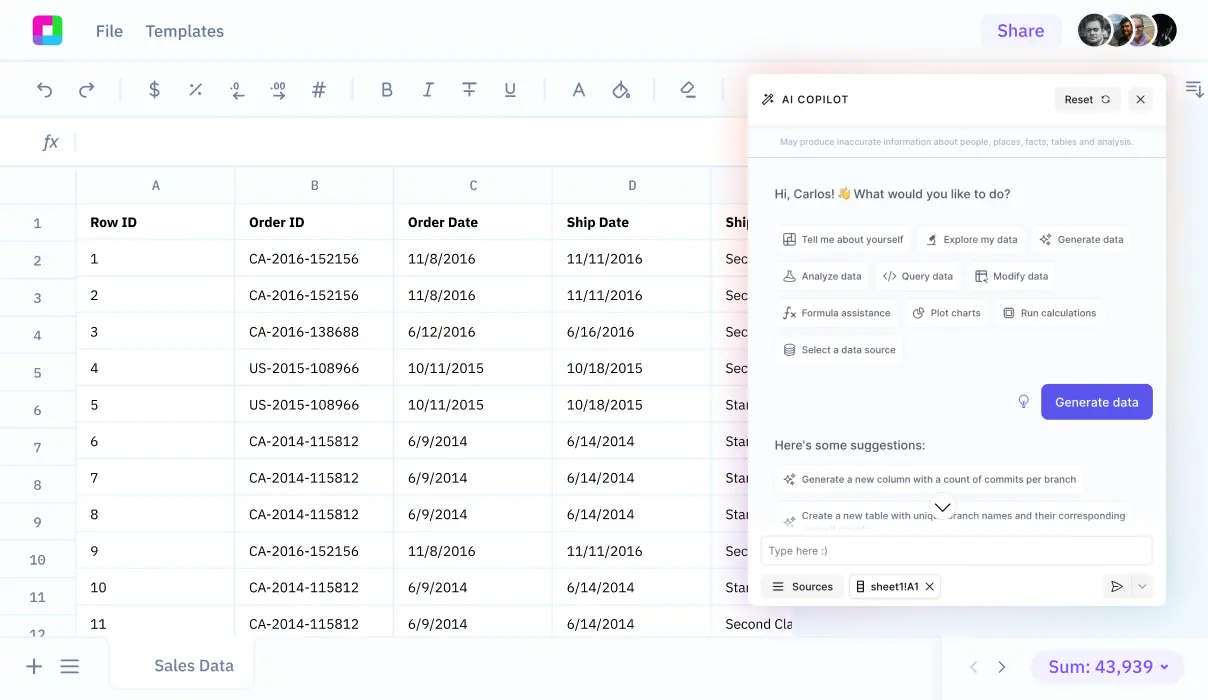
But here's the thing: database performance analysis doesn't have to feel like deciphering ancient hieroglyphics. With the right approach and tools like Sourcetable, you can transform complex performance metrics into clear, actionable insights that actually make sense.
Why Database Performance Analysis Matters
Transform your database from a bottleneck into a competitive advantage
Cost Optimization
Identify resource-hungry queries that are inflating your cloud bills. One optimized query can save thousands in infrastructure costs.
User Experience Enhancement
Faster queries mean happier users. Reduce page load times from seconds to milliseconds and watch your conversion rates soar.
System Reliability
Prevent crashes before they happen. Performance analysis reveals patterns that help you scale proactively instead of reactively.
Developer Productivity
Stop playing whack-a-mole with slow queries. Clear performance insights help your team write better code from day one.
Database Performance Analysis in Action
See how different industries tackle performance challenges
E-commerce Flash Sale Prep
A major online retailer used performance analysis to identify bottlenecks before Black Friday. By optimizing their top 10 slowest queries, they handled 300% more traffic without adding servers. Result: Zero downtime and $2M in additional sales.
Financial Trading Platform
A trading platform discovered that their portfolio calculation queries were taking 45 seconds during market hours. Performance analysis revealed missing indexes and inefficient joins. After optimization: sub-second response times and happier traders.
Healthcare Data Migration
A healthcare provider needed to migrate 10TB of patient data without disrupting operations. Performance analysis helped them identify the optimal migration windows and query patterns, completing the project 60% faster than estimated.
Gaming Leaderboard System
A mobile game company's leaderboard queries were timing out during peak hours. Analysis revealed that complex ranking calculations were being performed in real-time. Solution: Precomputed rankings that updated every minute instead of every query.
Your Database Performance Analysis Workflow
From data collection to optimization—here's how to turn metrics into results
Collect Performance Metrics
Gather query execution times, resource usage, wait statistics, and error logs. Don't just collect everything—focus on metrics that directly impact user experience and system stability.
Identify Performance Patterns
Look for trends across time periods, user loads, and system configurations. That "random" slowdown at 3 PM every day? It's probably not random—it's a pattern waiting to be discovered.
Analyze Query Performance
Examine slow queries, missing indexes, and inefficient joins. Use execution plans to understand exactly where your database is spending its time and why.
Prioritize Optimization Opportunities
Not all performance issues are created equal. Focus on optimizations that deliver the biggest impact with the least effort—your 80/20 analysis goldmine.
Implement and Monitor Changes
Deploy optimizations systematically and measure their impact. Performance tuning is an iterative process—what works today might need adjustment tomorrow.
Performance Problems You'll Actually Encounter
Let's get real about the performance issues that keep developers up at night. These aren't textbook examples—they're the messy, complex problems you'll face in production systems.
The "It Was Working Fine Yesterday" Mystery
Your application was humming along perfectly, then suddenly everything slowed to a crawl. No code changes, no new deployments. What happened? Usually, it's data growth hitting a performance cliff. That query that was lightning-fast with 1,000 records? Not so much with 100,000.
Analysis approach: Compare current query plans with historical baselines. Look for table scans that used to be index seeks, or joins that are now processing exponentially more data.
The "Death by a Thousand Cuts" Problem
No single query is particularly slow, but your system feels sluggish overall. This is often caused by inefficient patterns: N+1 queries, unnecessary data fetching, or poor connection pooling.
Analysis approach: Focus on query frequency and cumulative impact. A query that takes 50ms but runs 10,000 times per minute is your real bottleneck, not the 2-second query that runs once per hour.
The "Peak Hour Panic" Syndrome
Everything works fine during testing and light usage, but performance tanks during peak hours. This screams resource contention—CPU, memory, or I/O limits being hit when load increases.
Analysis approach: Correlate performance metrics with system resource usage and concurrent user counts. Look for blocking, deadlocks, and resource wait times.
Database Performance Analysis FAQ
What metrics should I focus on first?
Start with the big three: query execution time, CPU usage, and I/O wait times. These give you the clearest picture of where your performance bottlenecks actually are. Don't get lost in vanity metrics—focus on what directly impacts user experience.
How often should I analyze database performance?
Continuously monitor key metrics, but do deep analysis weekly or when you notice performance degradation. Set up automated alerts for critical thresholds so you catch issues before users do. Performance analysis shouldn't be a fire-drill activity.
What's the difference between slow queries and performance problems?
A slow query might not be a performance problem if it runs rarely and doesn't impact users. Conversely, a fast query that runs constantly can be your biggest performance problem. Context matters more than raw execution time.
Can I do performance analysis without being a DBA?
Absolutely! Modern tools like Sourcetable make performance analysis accessible to developers and analysts. You don't need to memorize SQL Server wait types or Oracle execution plan operators—focus on understanding the business impact of performance issues.
How do I know if optimization efforts are working?
Measure before and after. Track key metrics like average response time, throughput, and error rates. But don't just look at database metrics—measure end-user experience too. A 50% improvement in query time that doesn't improve page load times means you optimized the wrong thing.
What tools work best for performance analysis?
The best tool is the one you'll actually use consistently. Database-specific tools provide deep insights but often require specialized knowledge. Sourcetable bridges this gap by making complex performance data accessible through familiar spreadsheet interfaces with AI-powered insights.
Frequently Asked Questions
If your question is not covered here, you can contact our team.
Contact Us